Figure 1
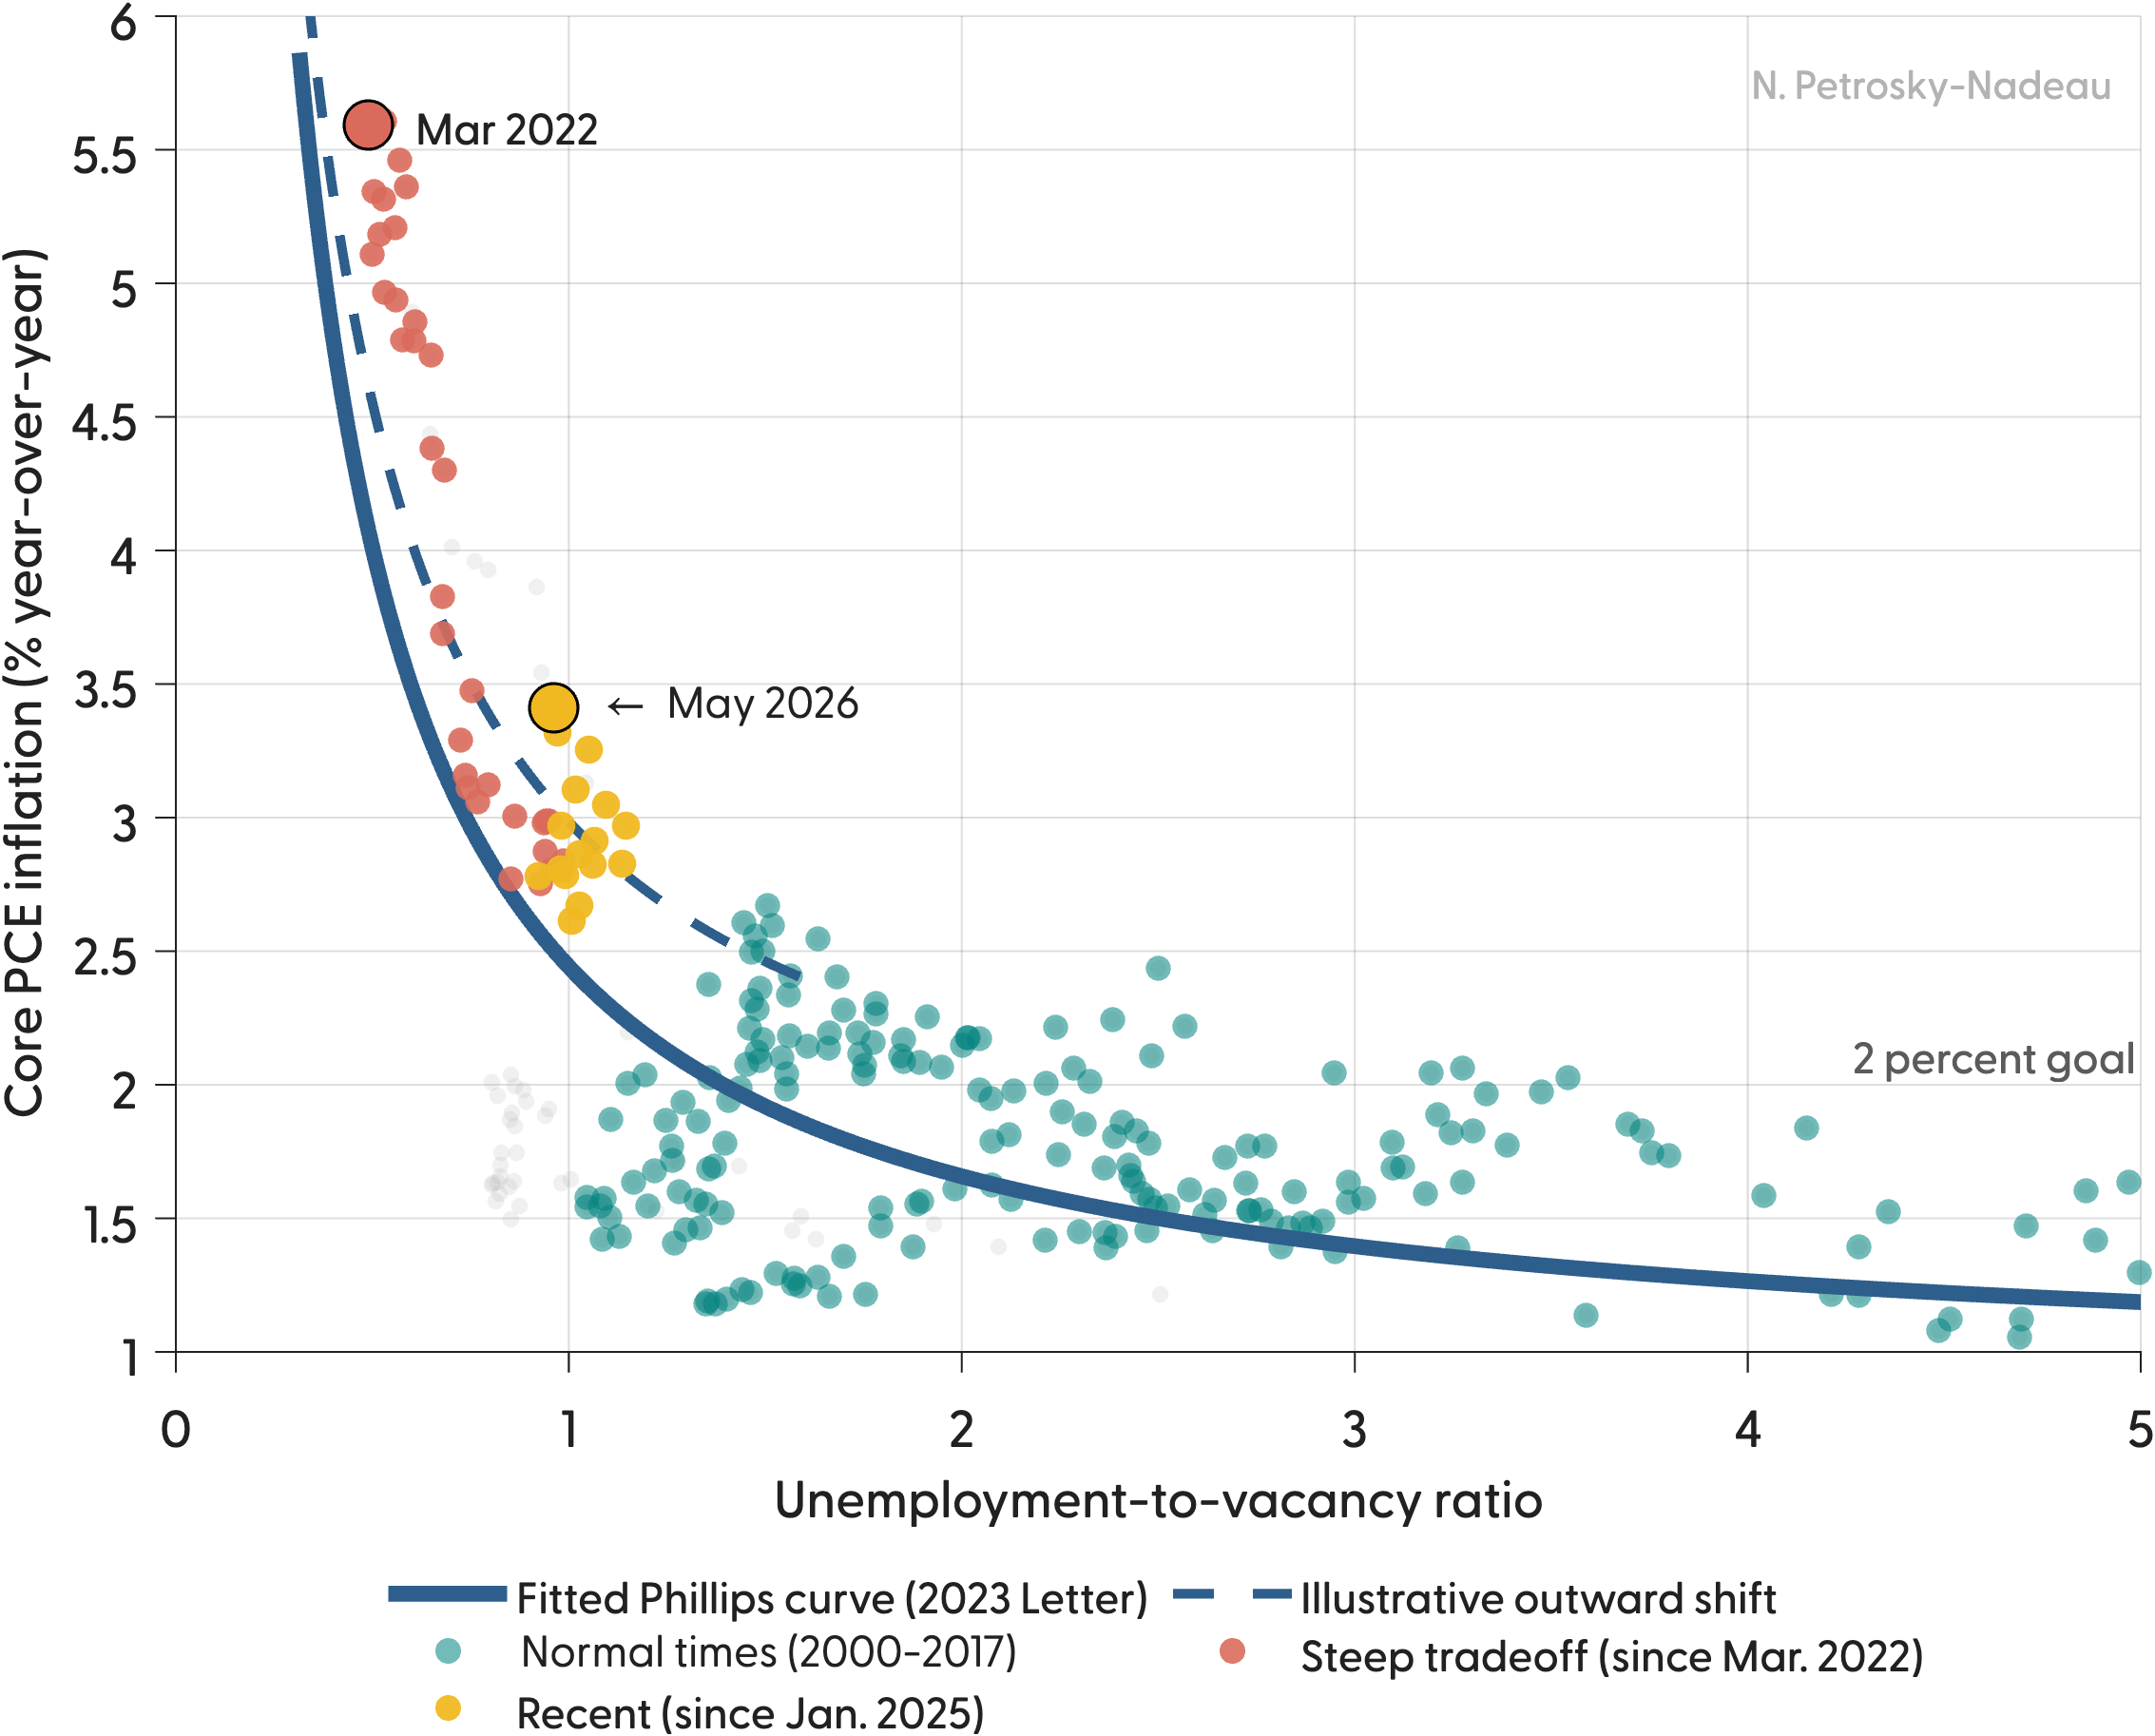
In 2023, my coauthors and I sketched a path for a soft landing (Crust, Lansing, and Petrosky-Nadeau 2023). A nonlinear Phillips curve, relating core inflation to the ratio of unemployed workers to job vacancies, was very steep when that ratio sat below 1.0. So a modest easing of a red-hot labor market, achieved mainly by shrinking job openings rather than raising unemployment, could bring inflation down without a recession. For a while, that is roughly what happened.
The path down assumed the curve itself would hold still. As the 2023 analysis put it, inflation would fall back toward 2% “provided that the Phillips curve remains stable with well-anchored inflation expectations.”
What the Data Now Show
The recent readings no longer sit on that curve. The Figure updates the relationship with data through May 2026. From the March 2022 peak (red dot, unemployment-to-vacancy ratio near 0.5, core PCE inflation of 5.6%), the economy descended along the steep segment much as expected. But the points since January 2025 (gold) have settled at a ratio close to 1.0, a fairly normal degree of slack, while inflation has held near 3% and climbed to 3.4% by May 2026. The fitted 2023 curve (solid blue line) implies about 2.5% at that ratio. In other words, inflation is running roughly 0.9 percentage point above where the historical curve places it.
That gap is the signature of a curve moving outward (dashed line), rather than the economy sliding along a fixed curve. A useful benchmark is 2018 and 2019, when a comparably tight market ran inflation of only about 1.8%, well below the current rate despite less slack. Negative supply shocks, from tariffs to disruptions in energy markets, can produce exactly the pattern we see, lifting the inflation associated with any given level of slack.
Why It Matters
If the curve has shifted rather than the economy simply having stalled on the way down, the remaining distance to 2% is no longer a matter of a little more labor market cooling. It would require the curve to move back, or a significant slowing in demand.