Figure 1
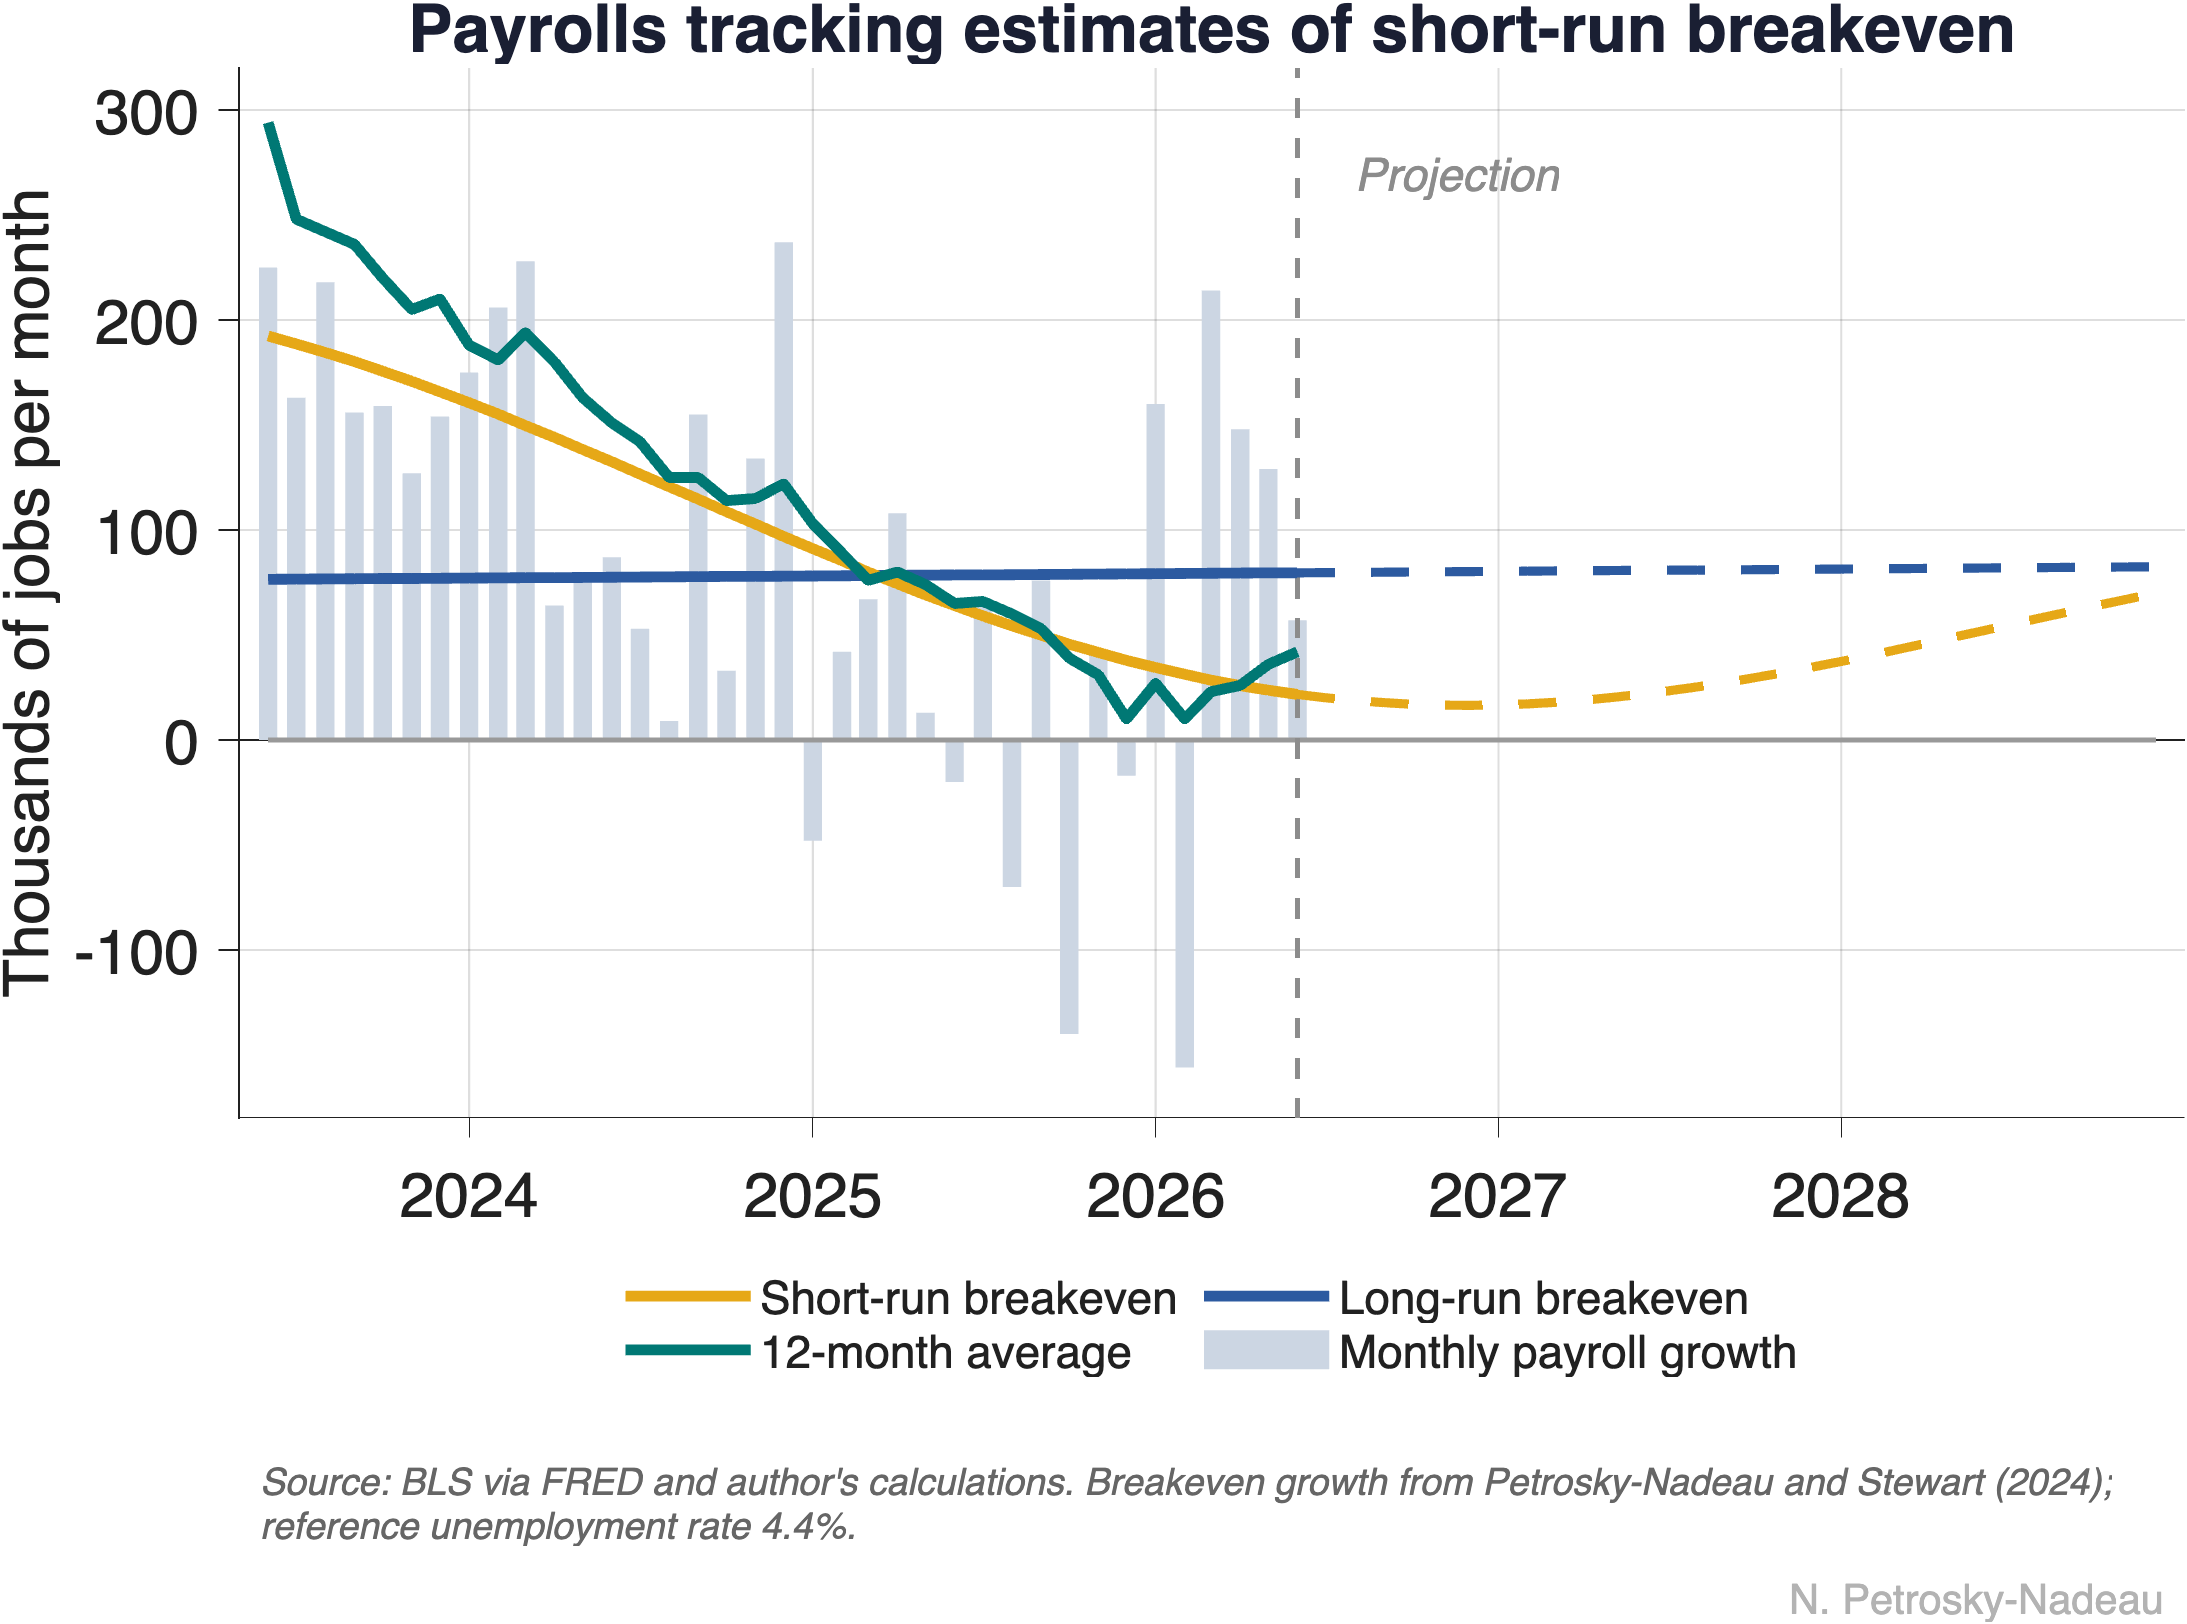
The most useful number to have in hand when reading the monthly jobs report may be the pace of hiring that would hold the unemployment rate steady. Economists call it the “breakeven” pace. Add jobs faster than breakeven and unemployment falls; slower, and it rises.
Where Breakeven Comes From
Breakeven is labor force growth translated into jobs needed to hold unemployment steady. Each month new workers enter the labor force, and hiring has to keep up just to absorb them. So we build breakeven from the labor force itself—its recent path and its projected path—rather than from payrolls. Labor force growth has both a shorter and a longer trend, which gives two breakeven estimates. A long-run estimate isolates slow-moving demographic forces: population growth, aging, and the trend in participation. A short-run estimate adds the medium-frequency swings that come from, for instance, immigration and shifts in participation. We define the long-run measure as the multi-decade trend in the size of the labor force, and the short-run as movements over a period of about six years (Petrosky-Nadeau and Stewart 2024). Extending the labor force with Census population projections lets us carry both estimates forward.
Job Growth Has Tracked Short-Run Breakeven Down
The Figure plots both estimates against the 12-month average of payroll growth (teal line). Over the past two years that average has fallen from roughly 150,000 to about 40,000 jobs a month, staying close to short-run breakeven (gold line) the whole way down. Short-run breakeven now sits near 20,000, well below the long-run estimate of about 80,000 (navy line). Because hiring and breakeven fell together, the gap between them stayed small. And it is that gap that moves unemployment. In other words, job growth cooled sharply without raising unemployment: the number of jobs needed to keep pace fell just as fast.
Why Short-Run Breakeven Is Set to Rise
The dashed lines extend each estimate forward, and the short-run measure turns back up, climbing from near 20,000 toward the long-run pace of about 80,000 by the end of the decade. The reason is that short-run breakeven is low today precisely because labor force growth is running below its demographic trend, held down by a pullback in immigration and a flattening in participation after its post-pandemic rebound. As those transitory forces fade, labor force inflows revert to the slower demographic pace, and the number of jobs needed to keep the unemployment rate constant rises back toward 80,000.
Why It Matters
Recent payrolls offer a first, tentative sign of this turn. The 12-month average has edged up from about 10,000 early in 2026 to roughly 40,000 in June. It is too soon to read much into so short a run of data. But if hiring and breakeven climb together, unemployment could stay steady even as the labor market firms—the same arithmetic that kept it steady on the way down, now working in reverse.
These estimates and the projection are now an interactive chart on the Data page, where readers can adjust the smoothing of payroll growth and see how the short-run estimate depends on how the recent trend is extrapolated.