Figure 1
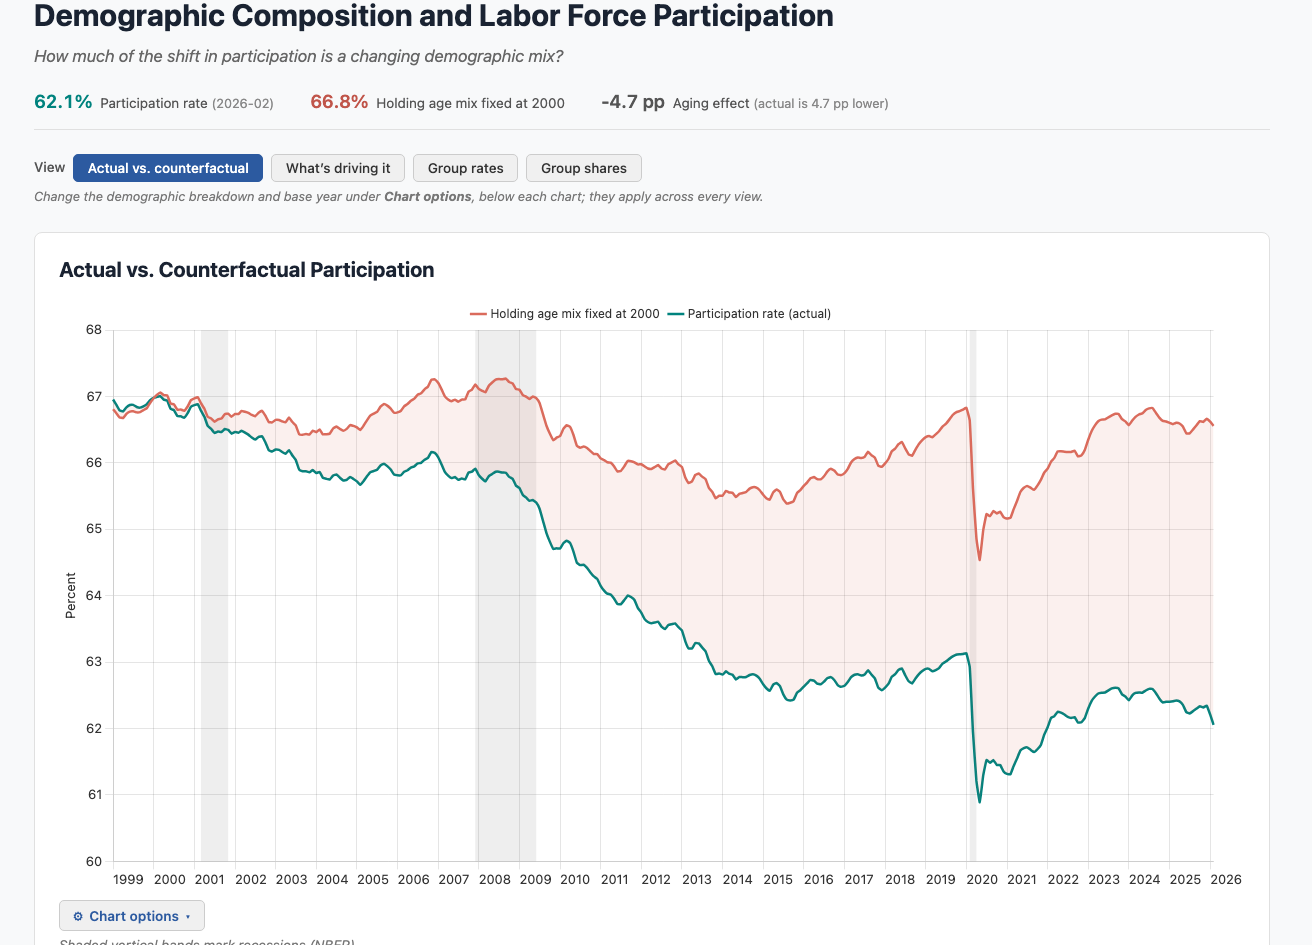
One number, two forces. An aggregate rate like this blends two things that move separately. The first is behavior: whether people in a given group choose to participate in the labor market. The second is composition: how large each group is in the population. When the population ages, its mix shifts toward older people who tend to participate at lower rates. This leads the aggregate rate to fall even if no one changes their own behavior. Separating the two is what demographic adjustment does. We hold the age distribution fixed at a base date, say the mix in 2000, let each age group participate at its actual current rate, and ask what the aggregate would have been.
Aging, not attachment. The Figure above shows the result. The actual rate (teal line) falls from a peak near 67% to about 62% today. The counterfactual holding the 2000 age mix fixed (salmon line) barely moves, sitting near 67% throughout. The two lines are indistinguishable through the 1990s and diverge only after 2000, as the large baby-boom cohorts age into their lower-participation retirement years. Aging alone accounts for about 4.7 of the 5 percentage point decline.
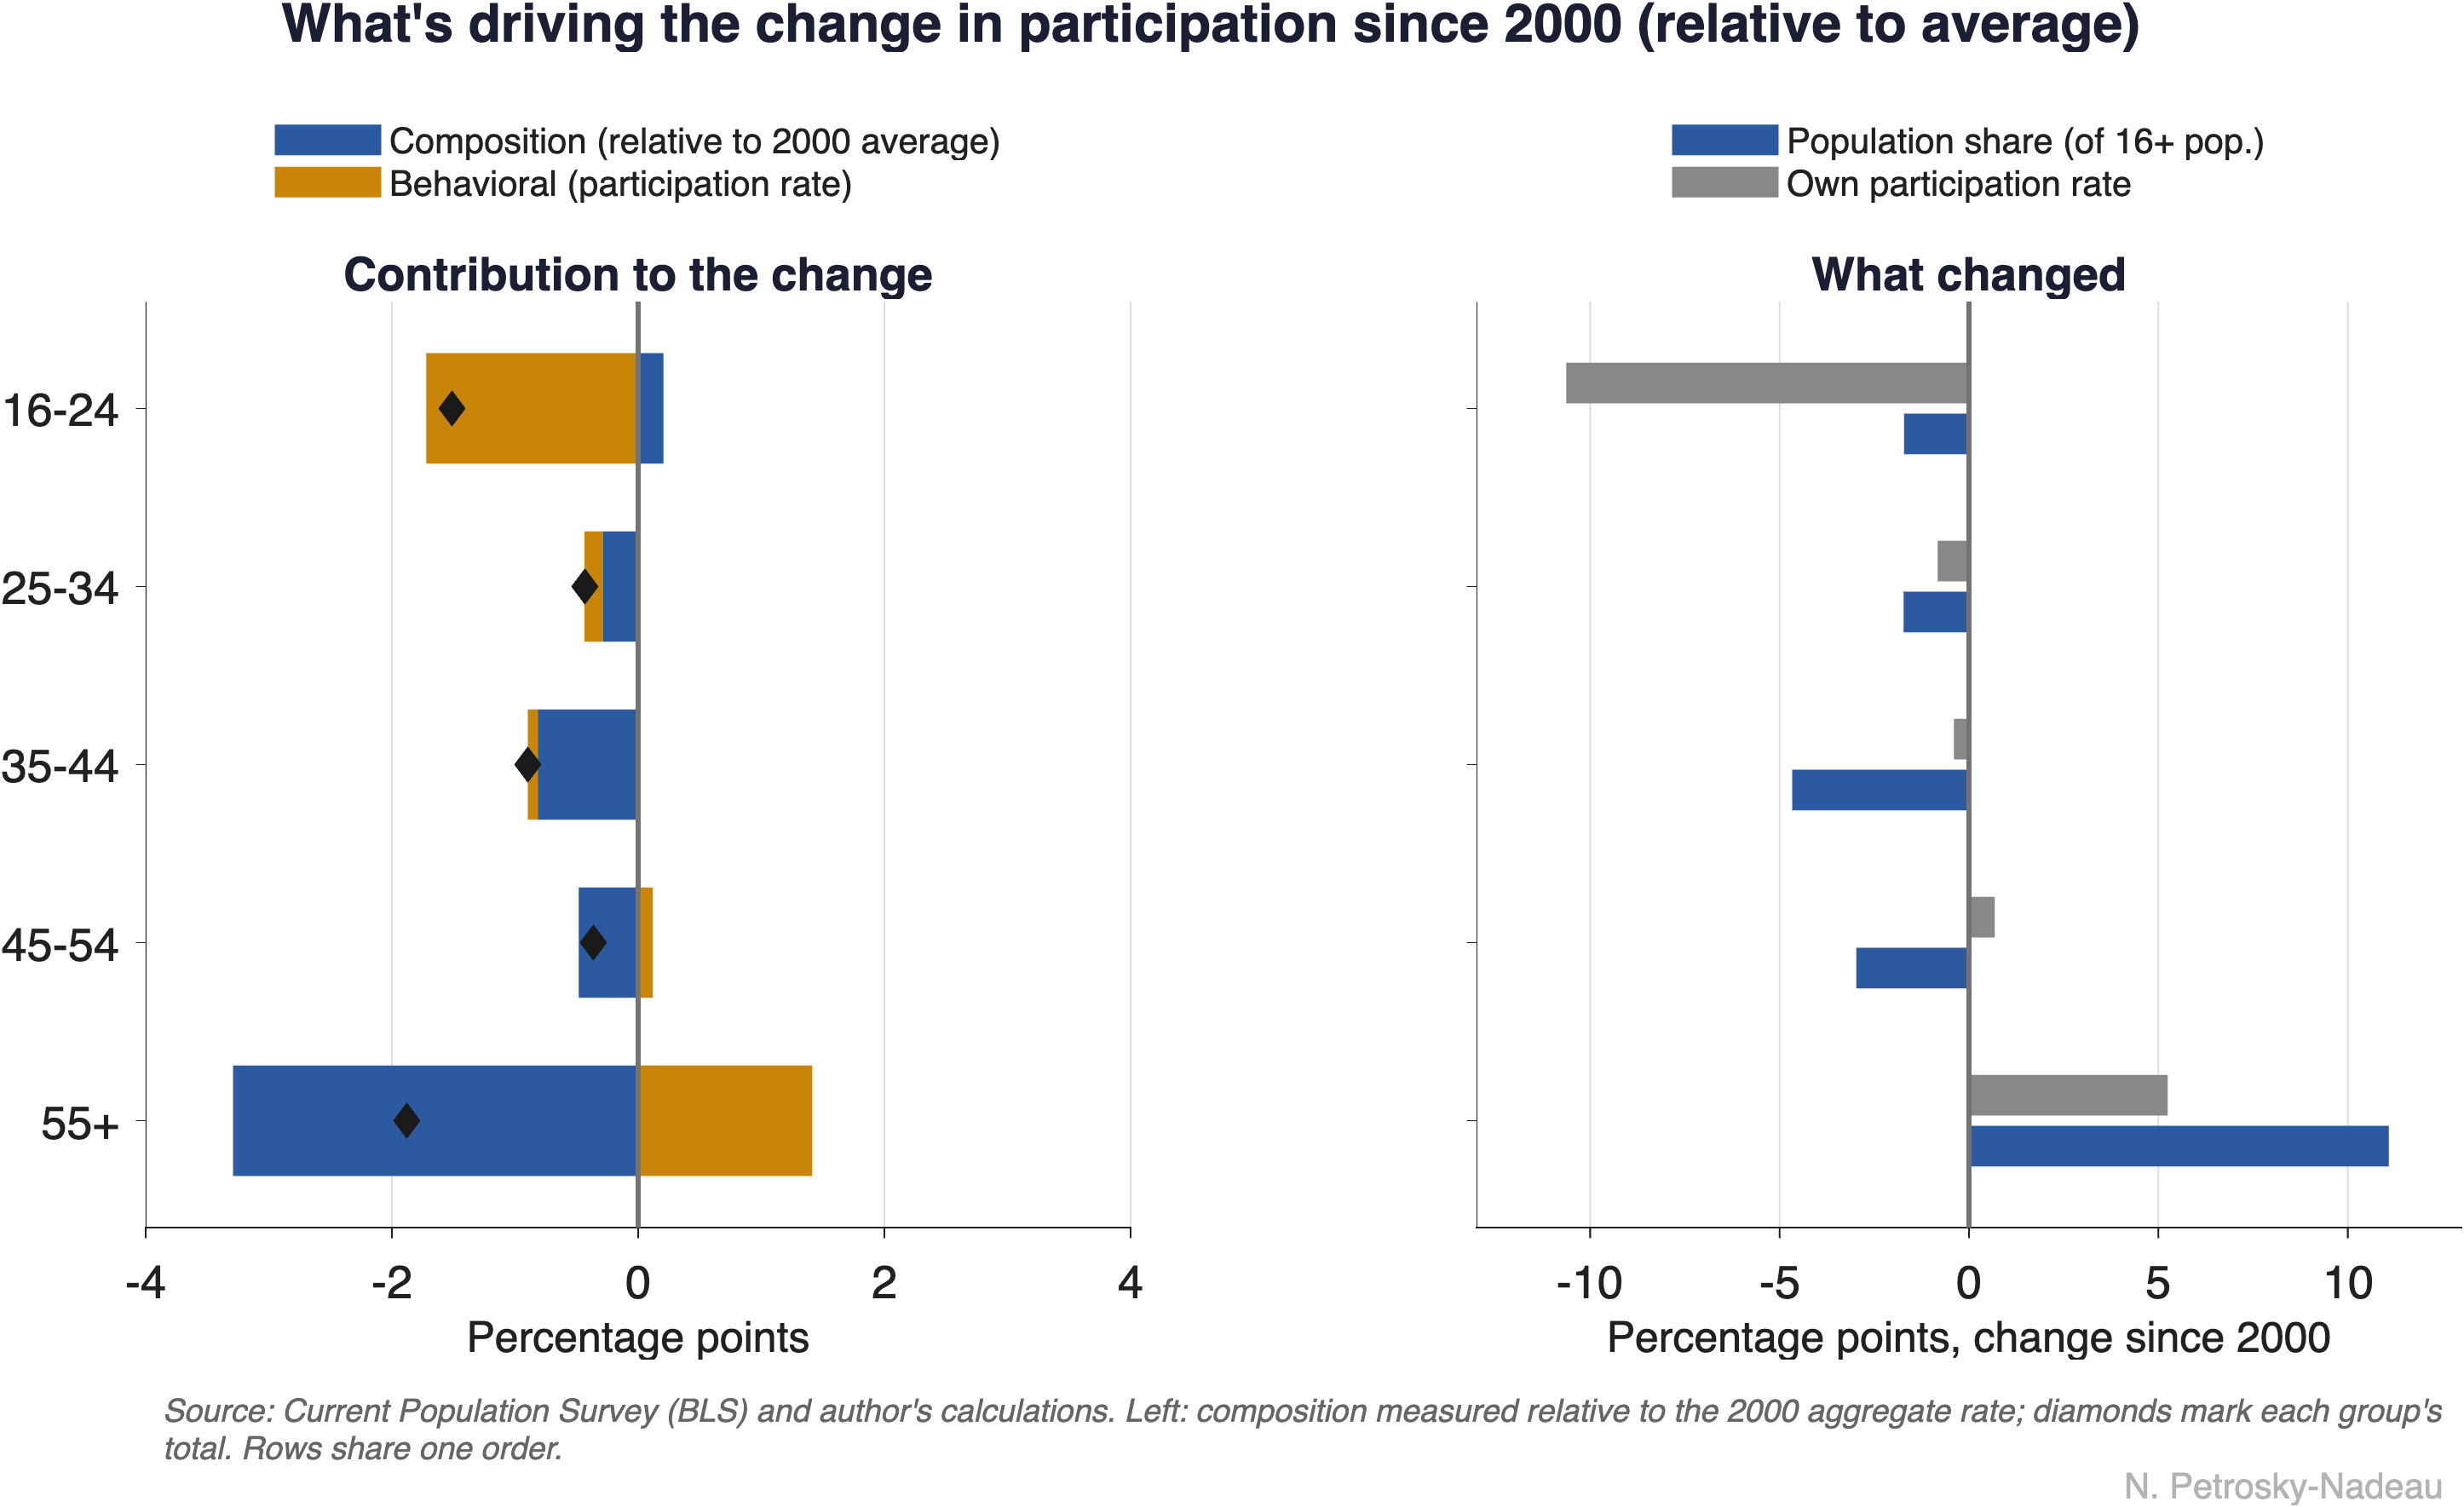
What is driving it. The Figure below opens up that change group by group. The right panel shows what actually moved: the 55-and-older share of the population rose about 11 percentage points since 2000, while every younger group’s share shrank. The left panel turns those movements into contributions to the aggregate change. Here I weigh each group’s shift in share against the overall 2000 participation rate of about 67%, so a group that grows but participates below that average registers as a drag. By that measure the growing 55-and-older share is the single largest drag, subtracting about 3.3 points through composition, even though this group’s own participation rate has risen. In other words, aging pulls the aggregate down not because older people withdrew from work, but because the population shifted toward a group that works less than the average.
Figure 2
Why it matters. Demographic adjustment tells you whether a change in participation really is a signal of the state of the labor market or an accounting artifact from changing demographics. To explore other cuts, an interactive version is now on the Data page, where you can hold the age, sex, or age-and-sex mix fixed at a range of base years and see the decomposition update.