Figure 1
The ins and outs of unemployment. Every month some workers enter unemployment and others leave it. Expressing each as a monthly rate lets us weigh what each margin contributed to the rise in unemployment. The inflow rate tracks entries into unemployment relative to the number employed a month earlier. The outflow rate tracks exits from unemployment relative to the number unemployed a month earlier. Both margins take into account that some people move into and out of the labor force, and so also make a minor adjustment for the size of the labor force.
Both margins have moved since 2023. The Bureau of Labor Statistics (BLS) Current Population Survey (CPS) measures both flows directly. The 12-month average of the inflow rate has risen from 1.96% to 2.13% since June 2023, while the outflow rate has fallen from 53.1% to 47.8%, as the two panels below show. To assess what those movements mean for unemployment, we use a simple relation that holds very well in the data: the unemployment rate is closely approximated by the ratio of the inflow rate to the sum of the inflow and outflow rates. The Unemployment Flows tab on the Data page carries the evidence for how well.
Figure 2
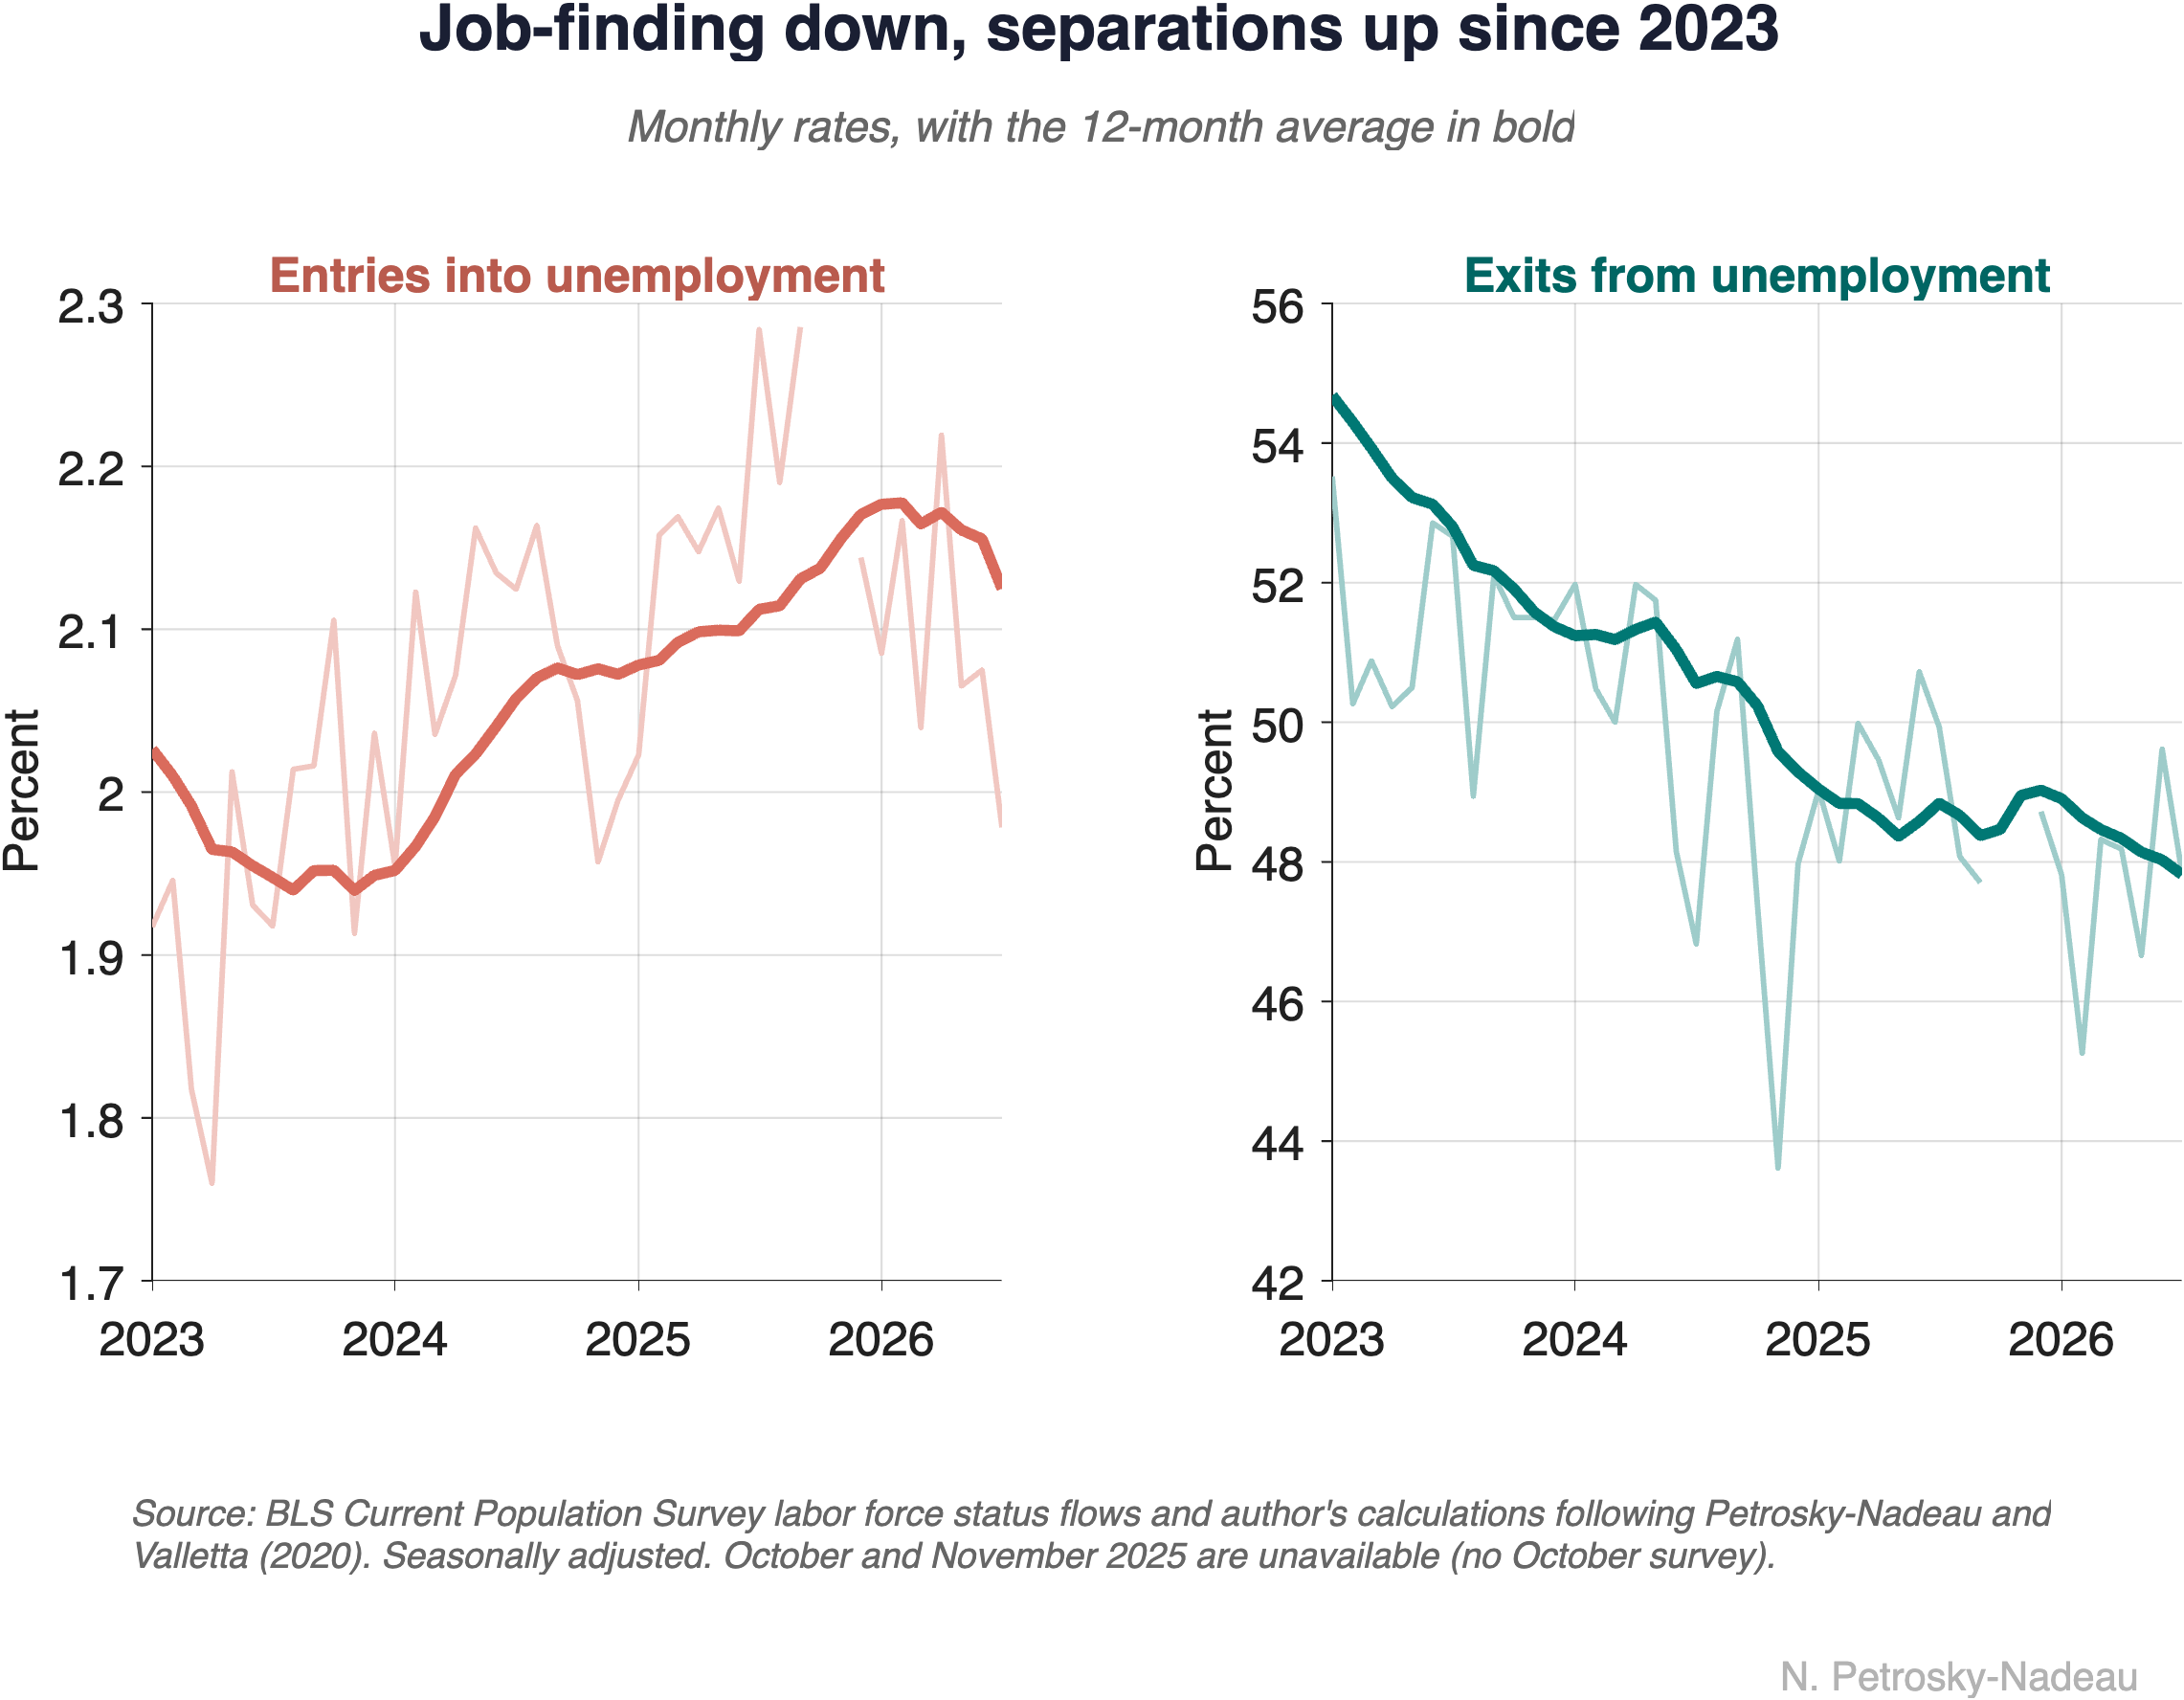
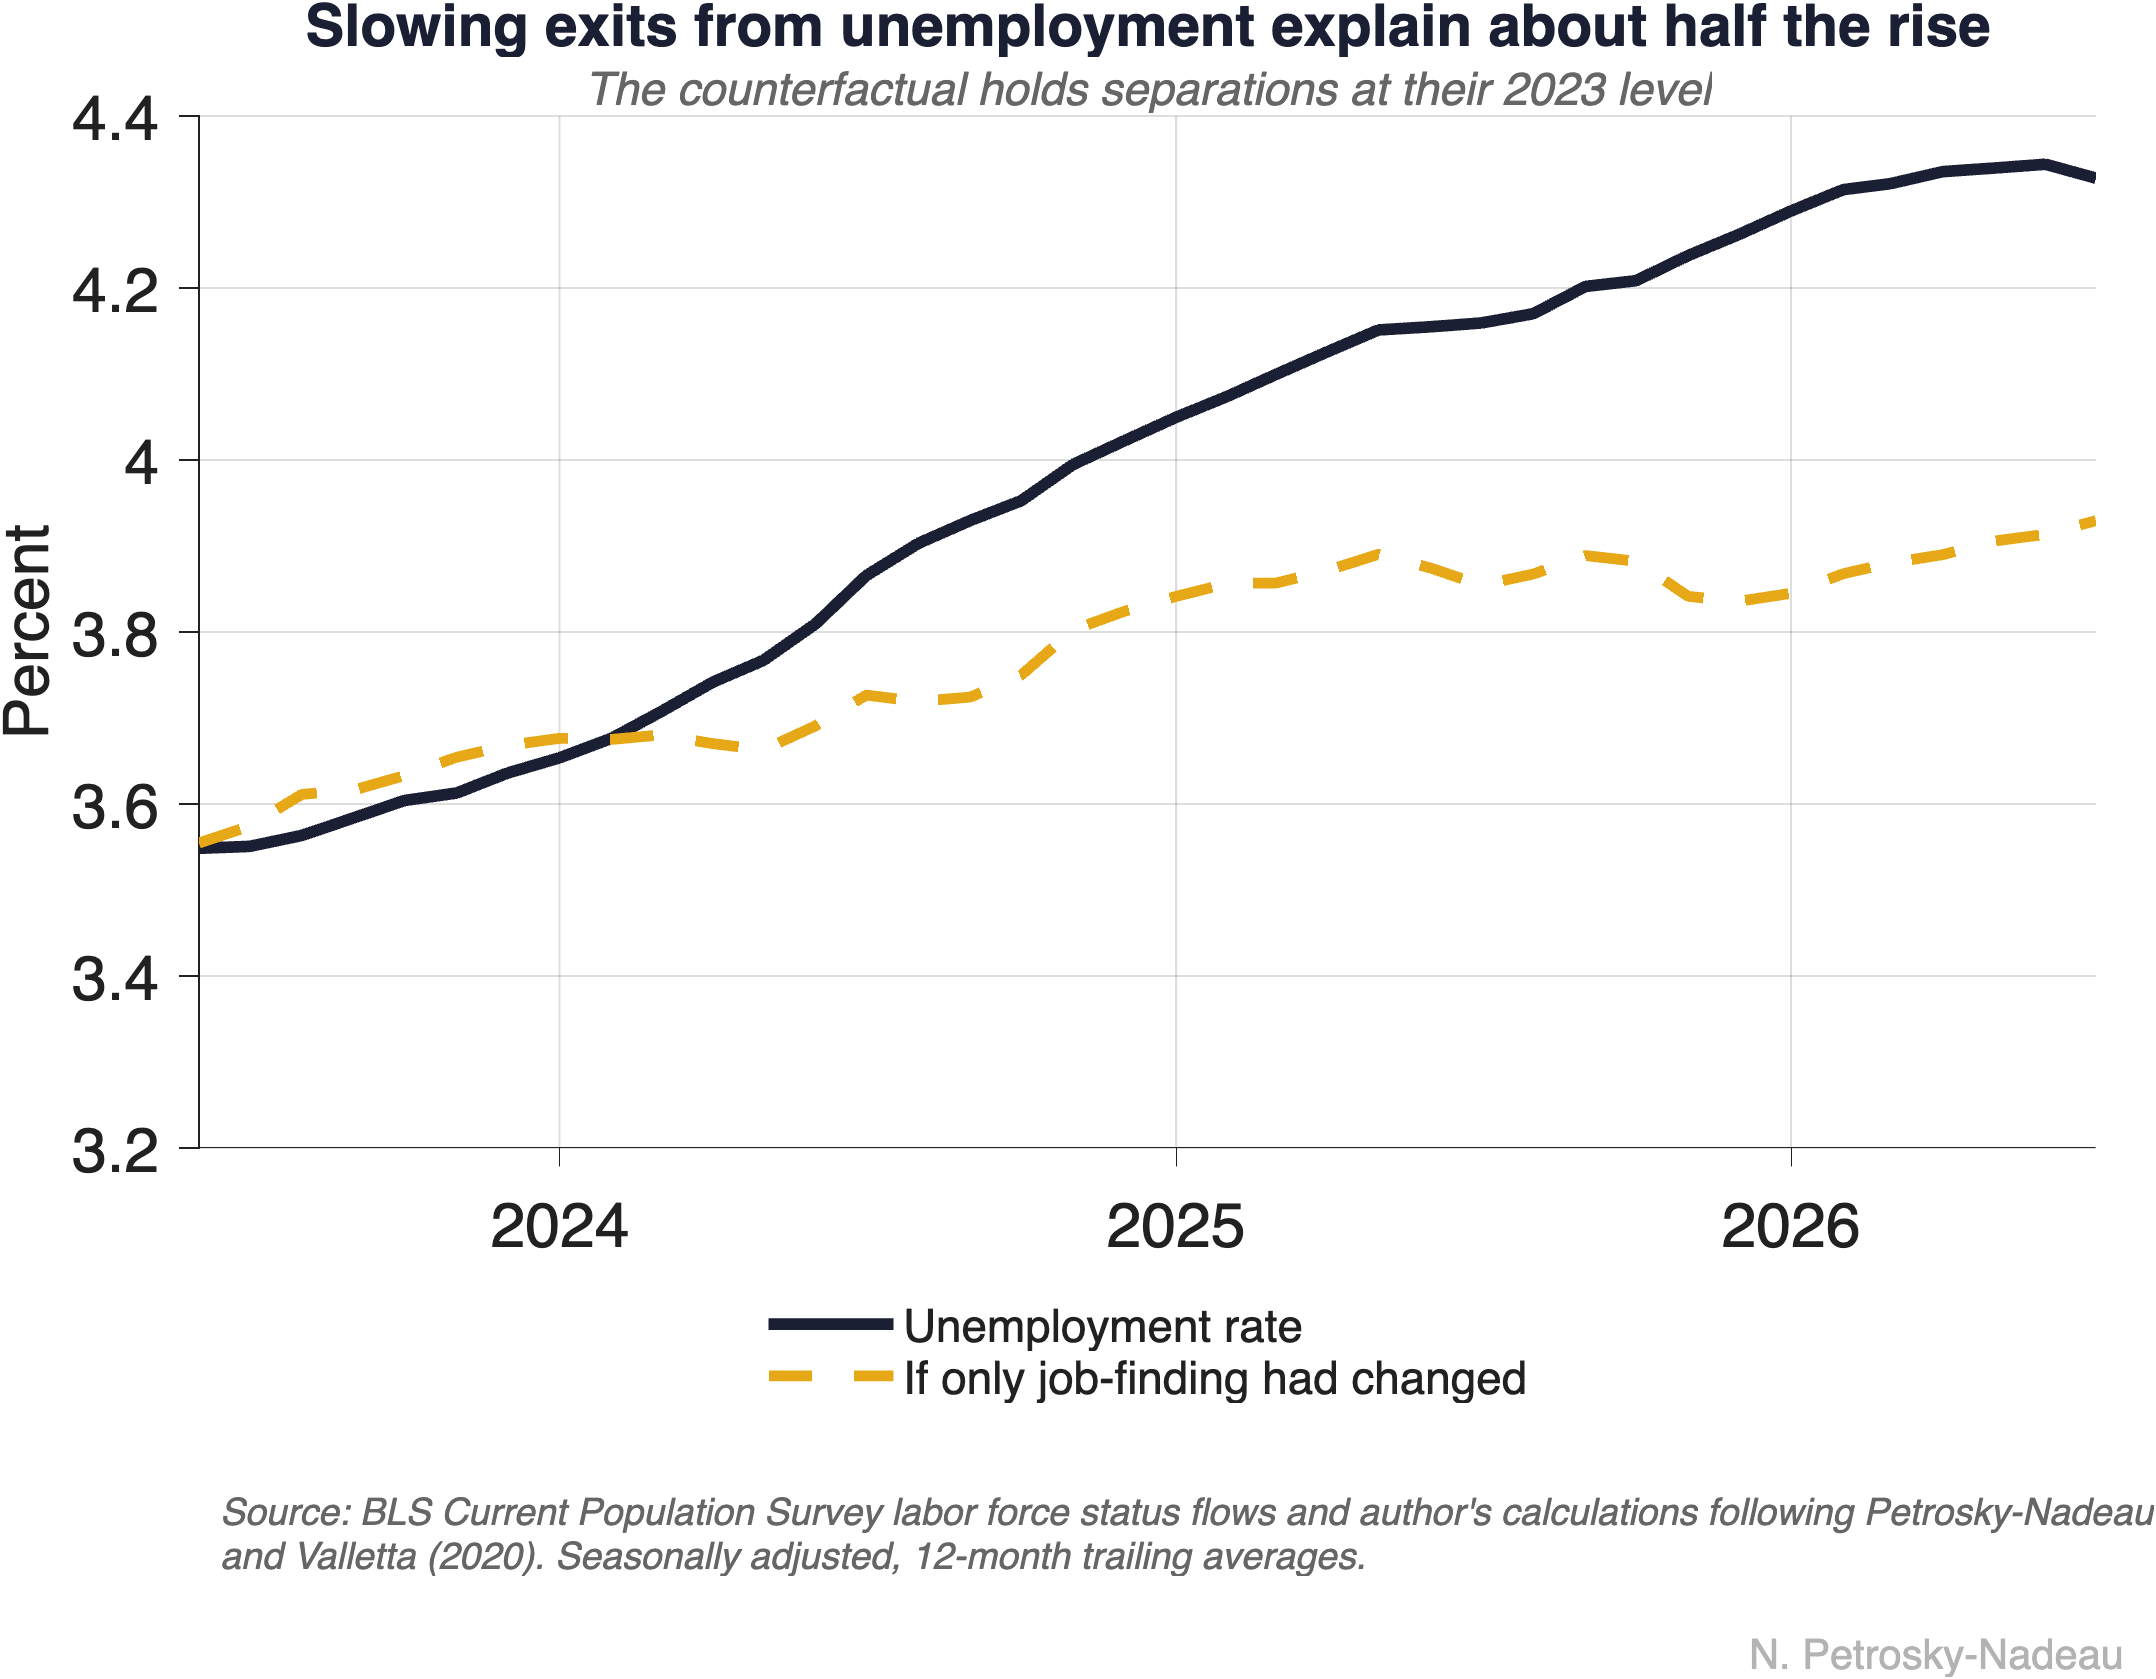
Slower unemployment outflows are not the whole story. The two rates differ by an order of magnitude in level, so a small absolute change in the inflow rate carries as much weight as a large one in the outflow rate. In proportional terms the two moved almost symmetrically, the inflow rate up about 9% and the outflow rate down about 10%. Holding one rate at its 2023 level and letting the other evolve as observed, the higher inflow rate accounts for roughly 42% of the rise in the implied unemployment rate and slower job-finding for roughly 54%. The Figure at the top of this note puts the same arithmetic in levels: with the inflow rate held at its 2023 level and the outflow rate alone changing, the unemployment rate would have averaged about 3.9% over the past year rather than 4.3%.
Separations remain historically low. A labor market in which both margins are contributing is a different setting from one in which only job-finding has cooled. Whether the inflow rate keeps climbing is worth watching. It remains low by the standards of the past three decades: the inflow rate averaged 2.85% from 1990 through 2019, well above its current level, though only a little above its 2019 average of about 2%. Monthly series for both rates, together with their components and the approximation above, are now on the Data page.