Fourteen months. That's how long the labor market has been stuck at the same point on the Beveridge curve.
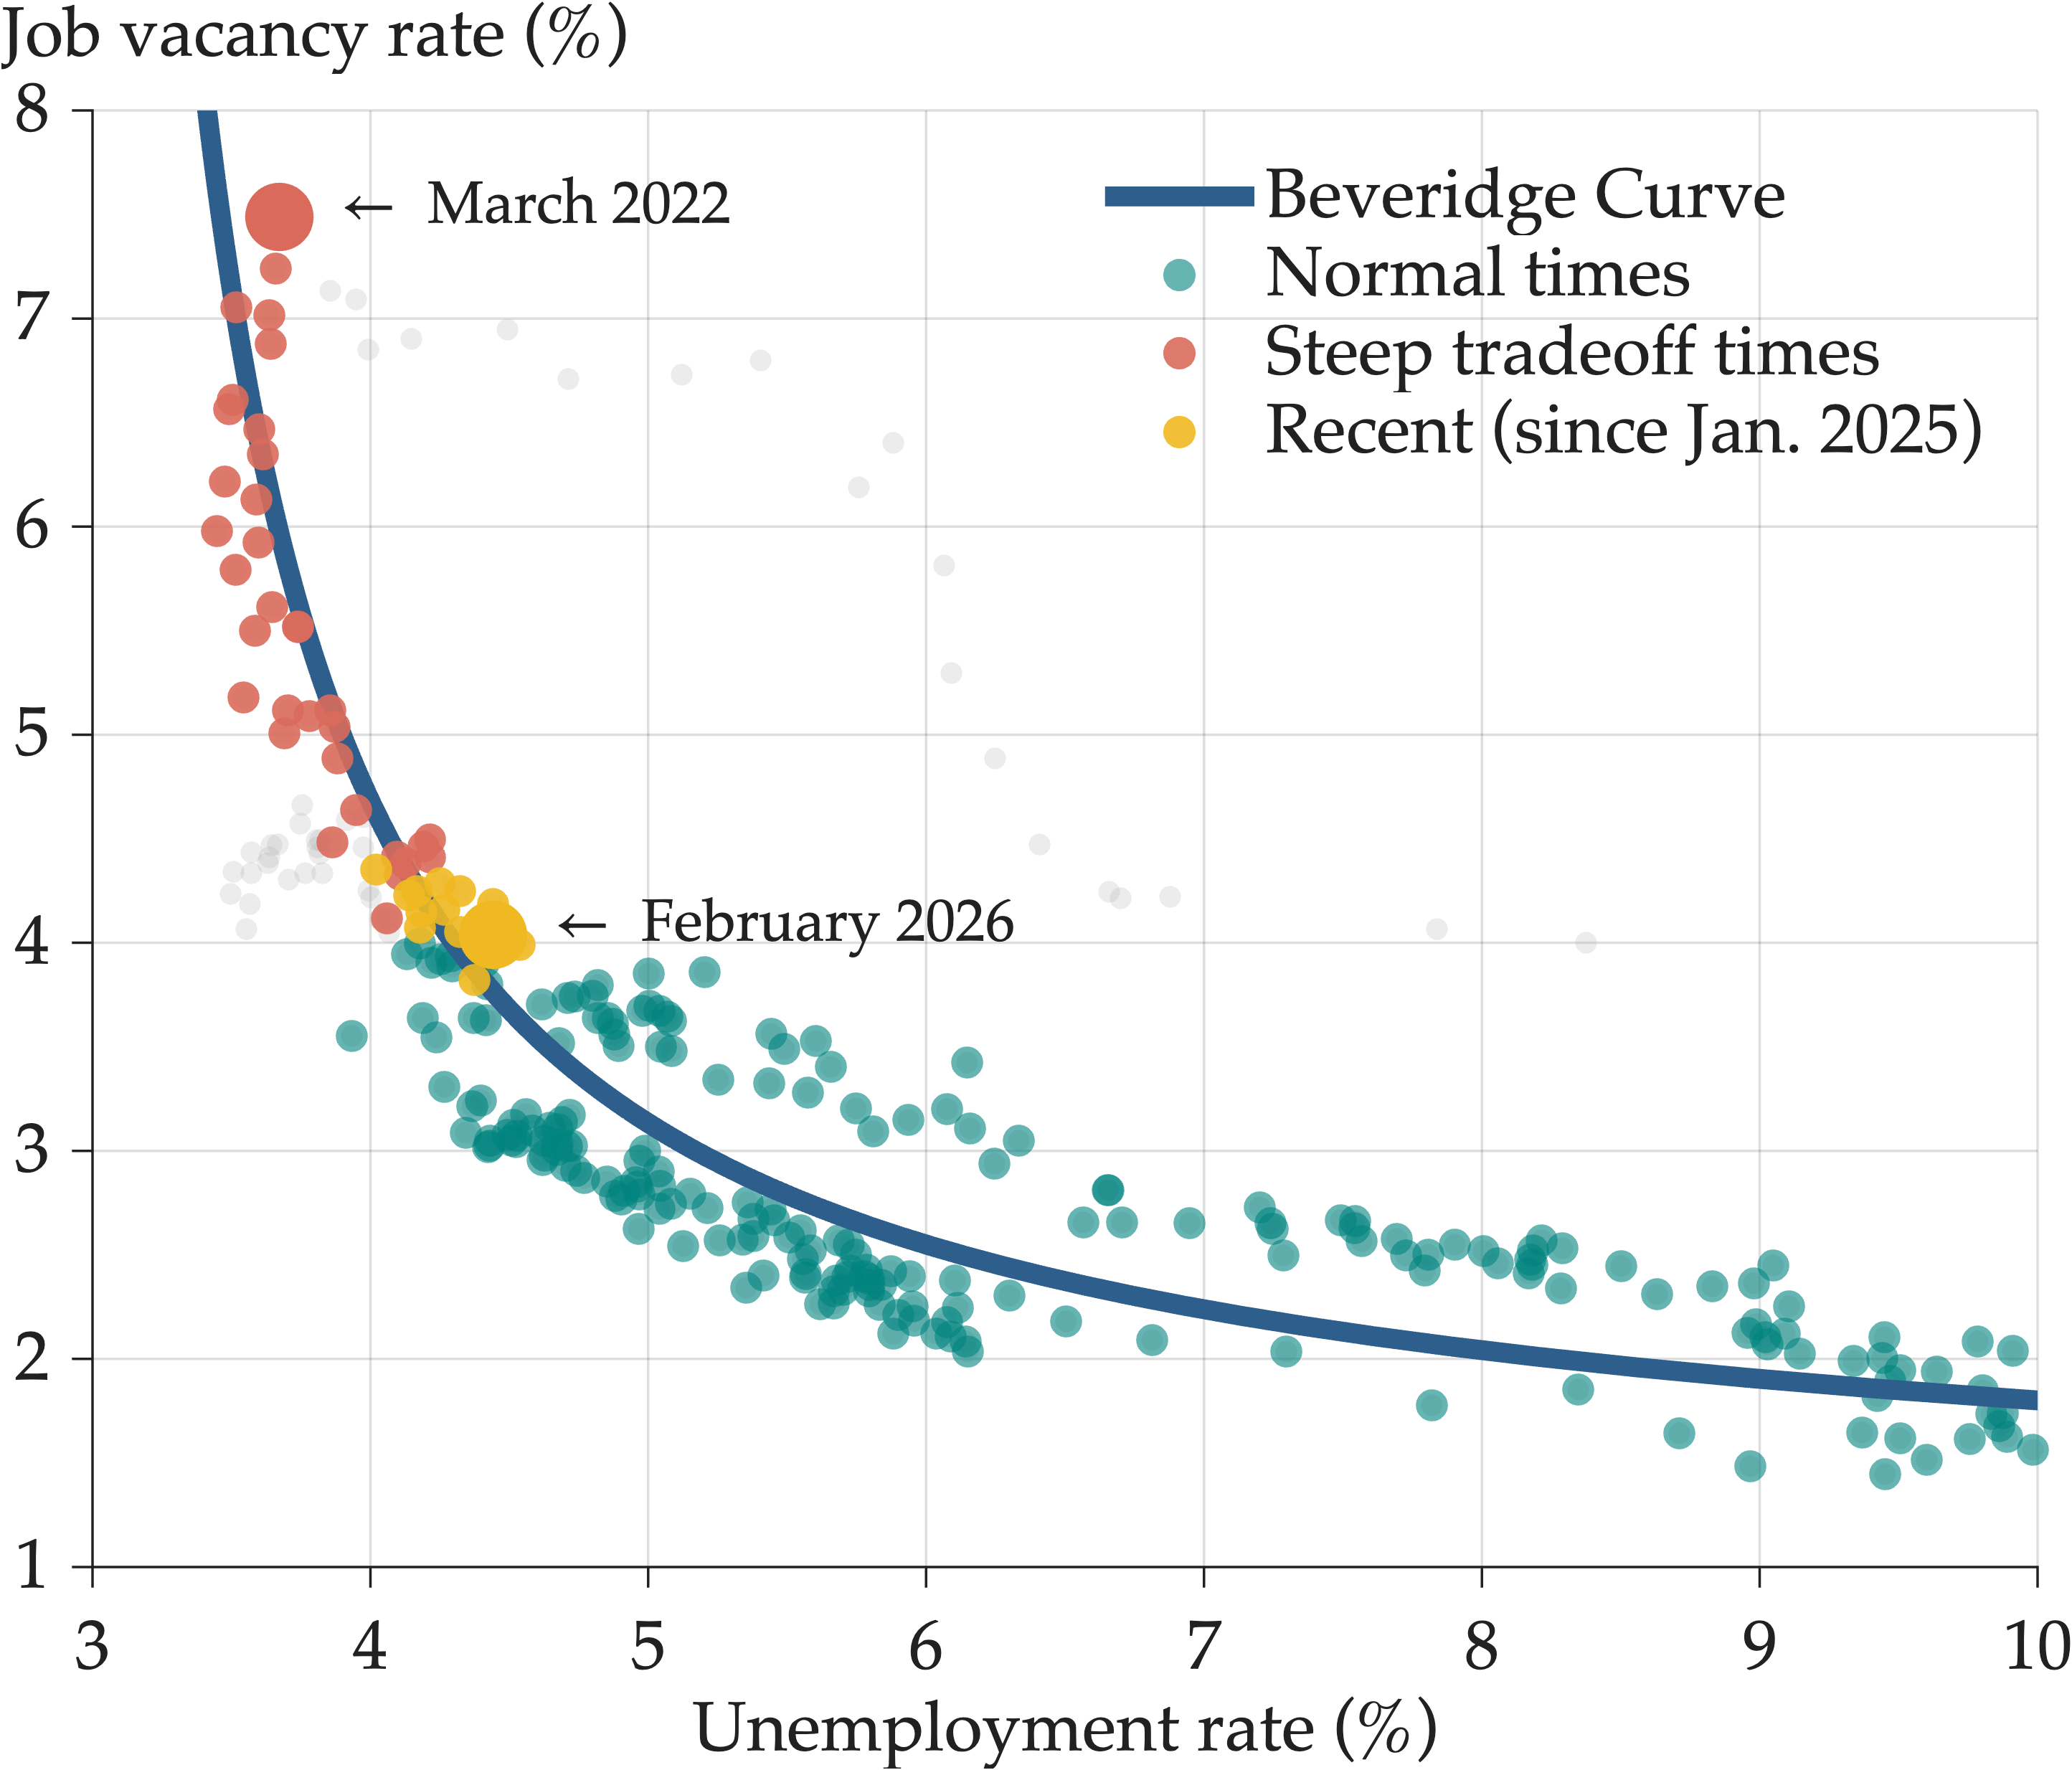
Coming out of the pandemic the story was a steep favorable tradeoff—vacancies falling along the steep portion of the curve with little change in unemployment. The yellow dots show what happened next: nothing. Since January 2025, we've hovered at 4% unemployment and 3.5-4% vacancies month after month.
The descent stopped. Now we wait to see which direction it breaks in 2026.