I often hear that Americans are less willing to work than they used to be, pointing to a participation rate that has fallen about five points since 2000.
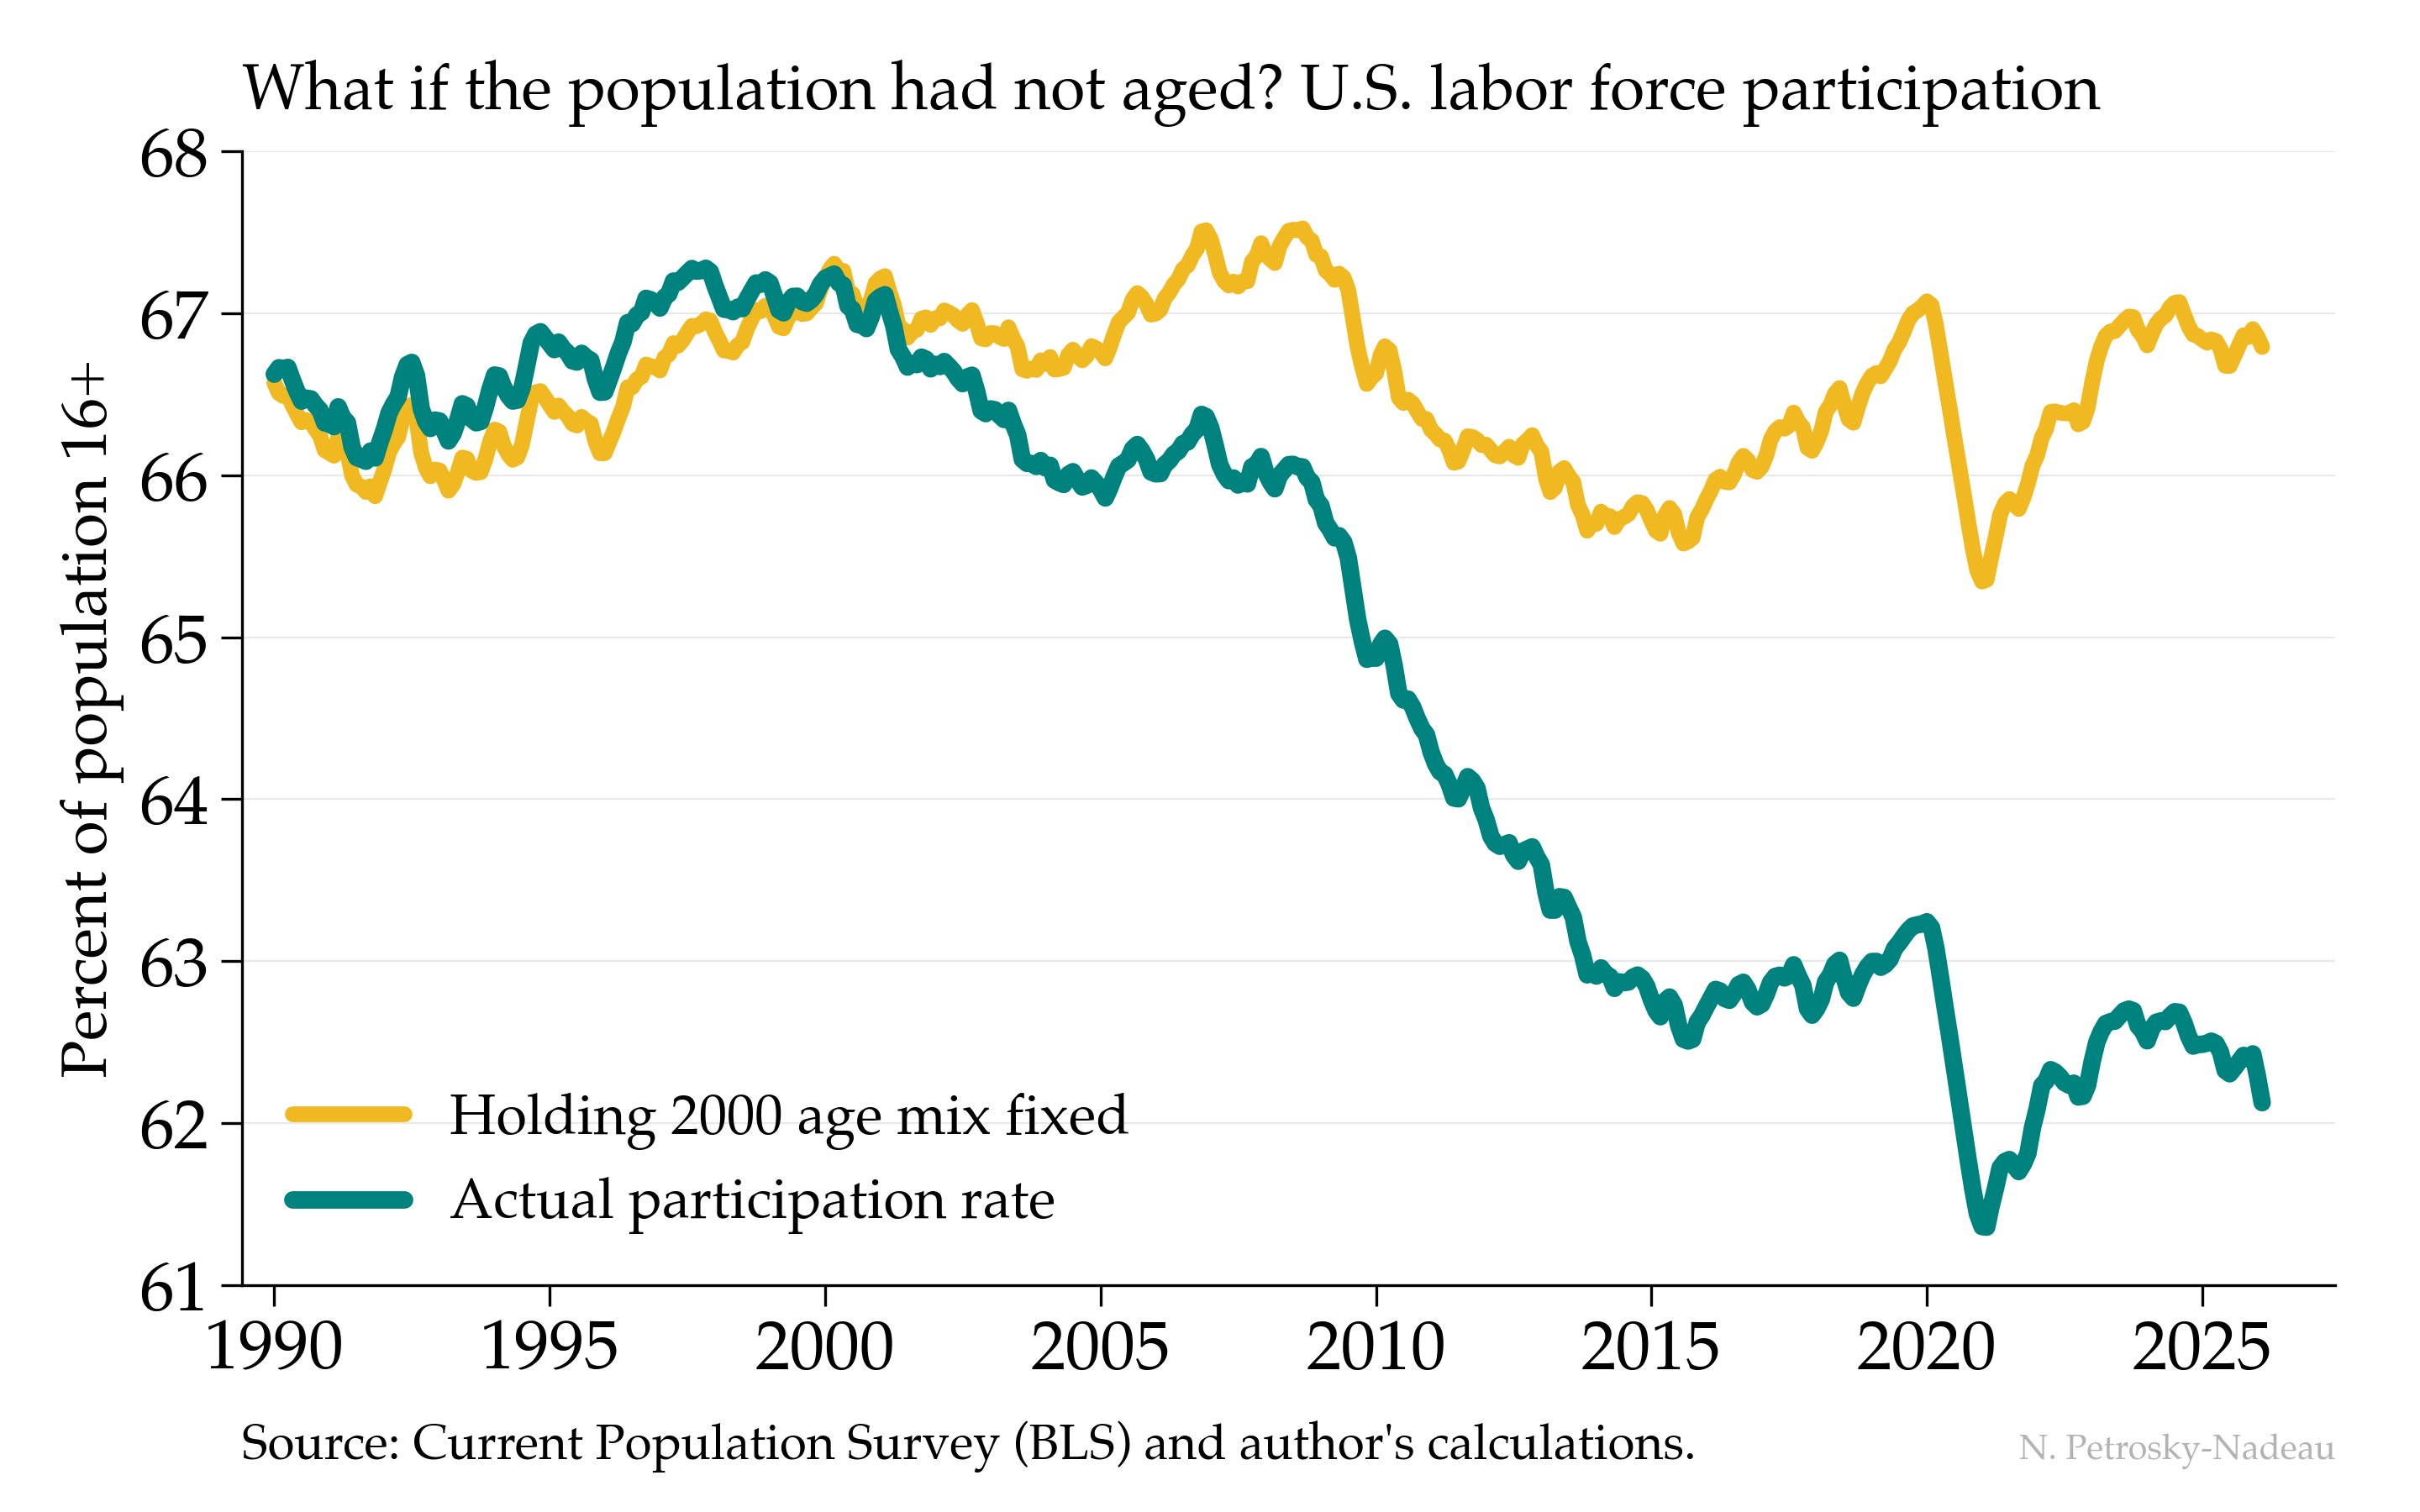
The teal line shows that decline, from a peak near 67% to about 62% today. The gold line asks a different question: what would participation have done if the age distribution of the population had simply stayed at its 2000 mix, with each age group participating as it actually does now? Almost nothing—it sits near 67% throughout. Nearly the entire drop is the baby-boom cohorts aging into their retirement years, not a generation stepping back from work.