Startups can be counted two ways, and for three decades it did not matter which you chose. New firms as a share of all businesses and the jobs they bring as a share of all employment fell together from the early 1980s through 2012, the decline in business formation that Benjamin Pugsley and Ayşegül Şahin documented and connected to slower employment growth and weaker recoveries.
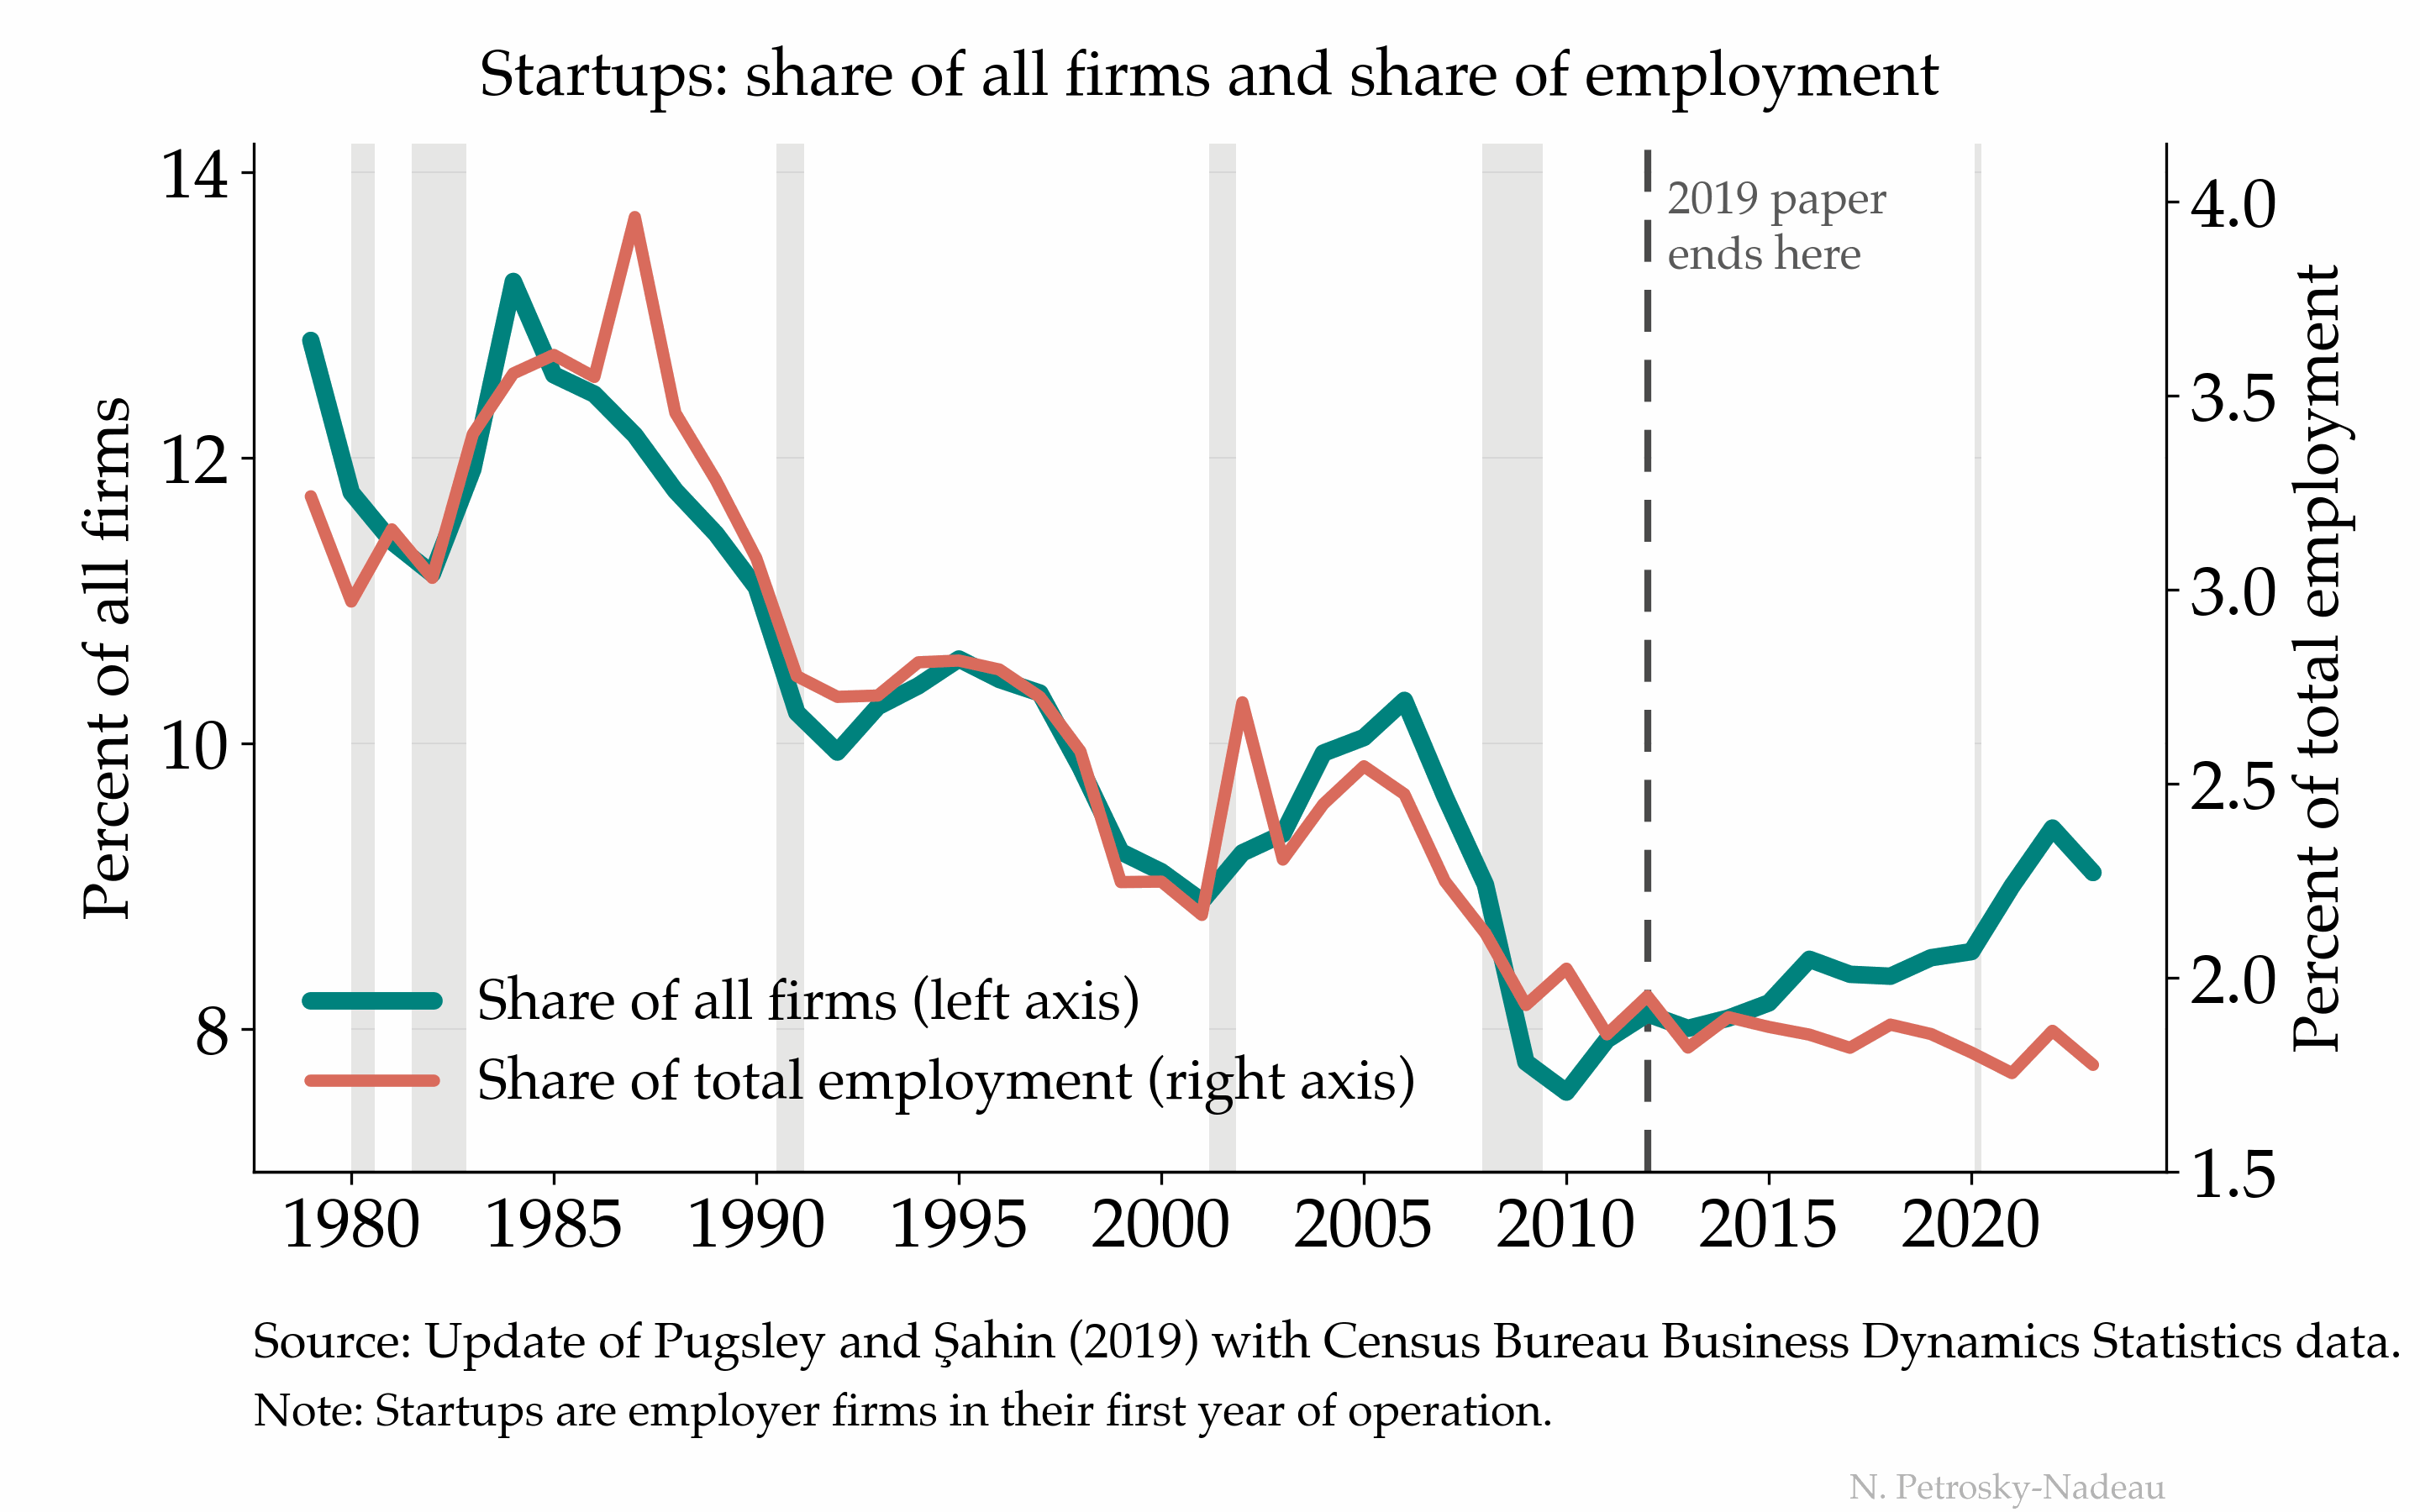
The two have come apart since about 2015. Startups (teal) have gone from 7.6% of all employer firms in 2010 to 9.1% in 2023, recovering roughly a third of their earlier decline, with the steepest gains around the pandemic. Their share of employment (salmon) has not moved with them: at 1.8% it sits close to its lowest reading in the whole series and essentially where it was a decade ago.
Whatever is generating more new businesses is generating notably smaller ones.