Pay grows fastest early in a career, so 21-to-30-year-olds normally see faster wage growth than 35-to-54-year-olds. In 2016–2019 the gap was about 3 percentage points. By August 2026 it was down to 1.8 (teal), closer to the slack labor markets of 2003–2005 and 2009–2014, and well below the 2.9 that today’s unemployment rate would imply on its 1994–2019 relationship with the gap (gold).
Wage growth, ages 21–30 minus ages 35–54
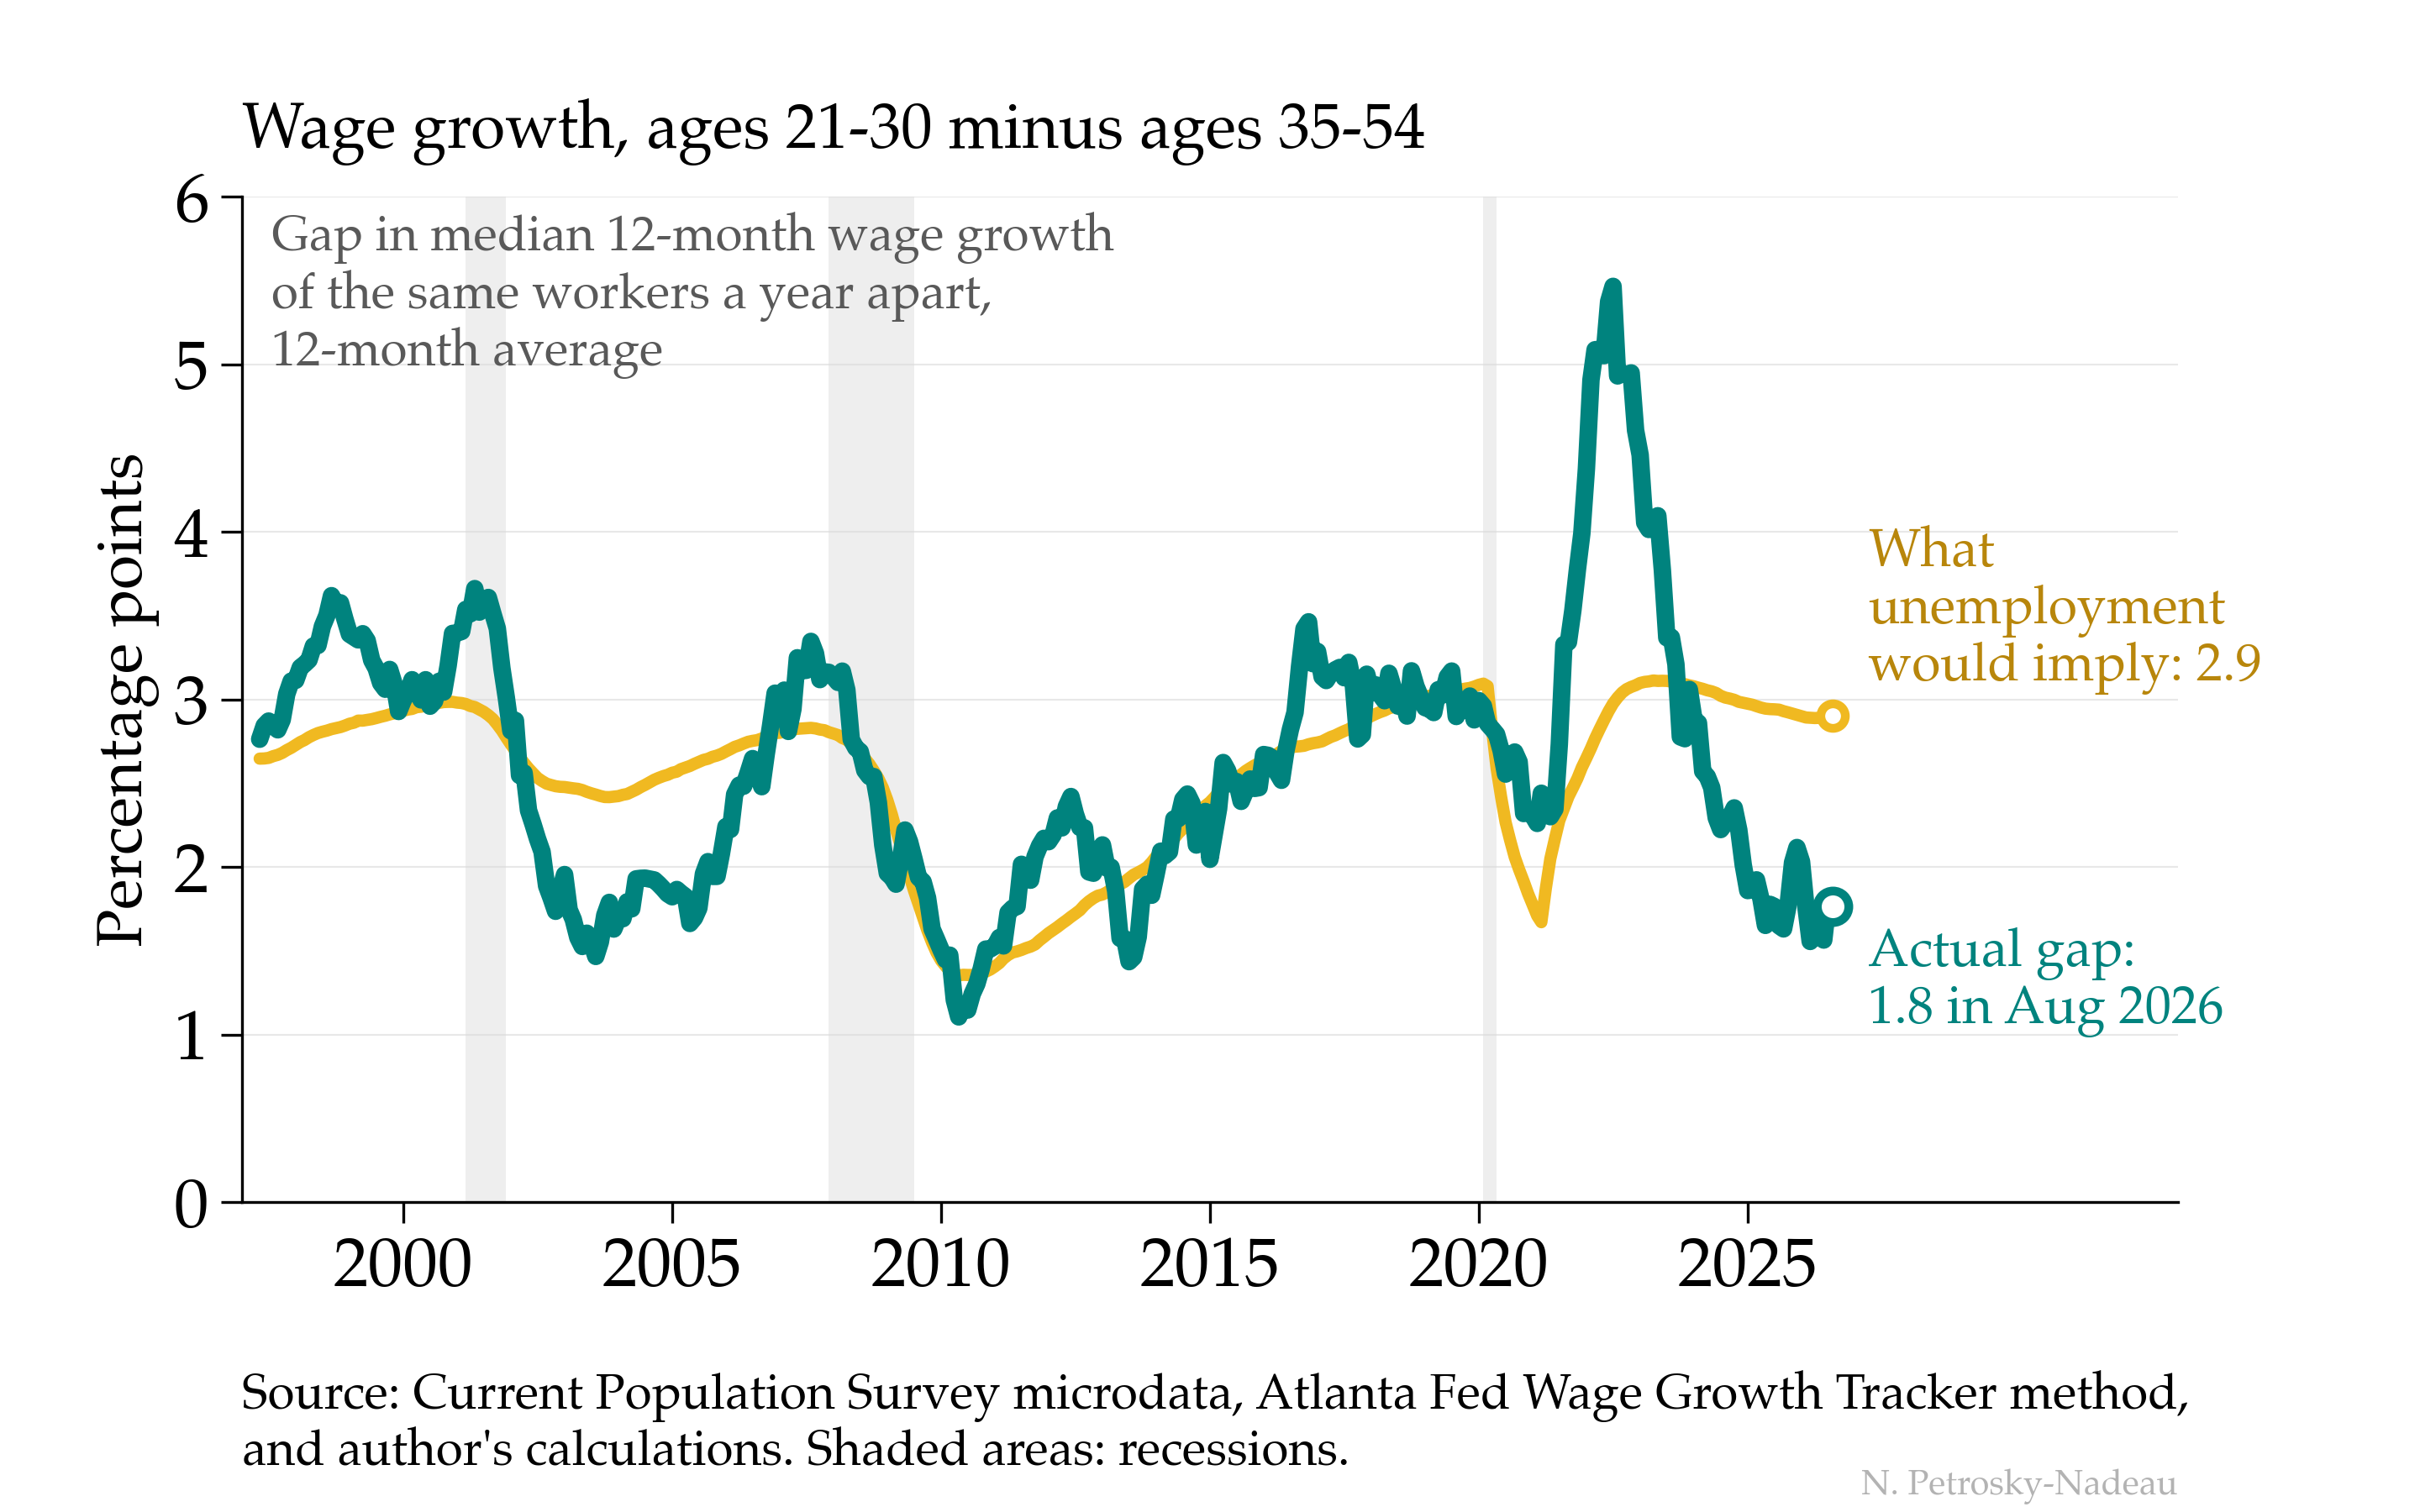
Gap in the median 12-month wage growth of the same workers a year apart, 12-month average. The unemployment and hiring lines are the gaps those rates would imply on their pre-2020 relationships with it. Shaded areas: recessions. Source: Current Population Survey microdata, Atlanta Fed Wage Growth Tracker method, and author’s calculations.
Hover or tap for values; click a legend entry to show or hide a line.
Most of the narrowing, about 60%, is on the mid-career side: median wage growth for 35-to-54-year-olds averaged 3.8% in 2025–2026, up from 3.1% in 2015–2019, while the young slowed from 6.0% to 5.6%. In 2026 alone, though, the slowdown among the young has been the larger part.
Measured against the slow pace of hiring instead, the gap is about where the cycle would put it, at 1.9 points. A labor market that hires slowly and rarely lays off appears to favor those with experience.