Employers are hiring 22-to-24-year-olds far less often than they used to, one more sign of a harder start for early-career workers.
New-hire rate of young workers relative to ages 35–54
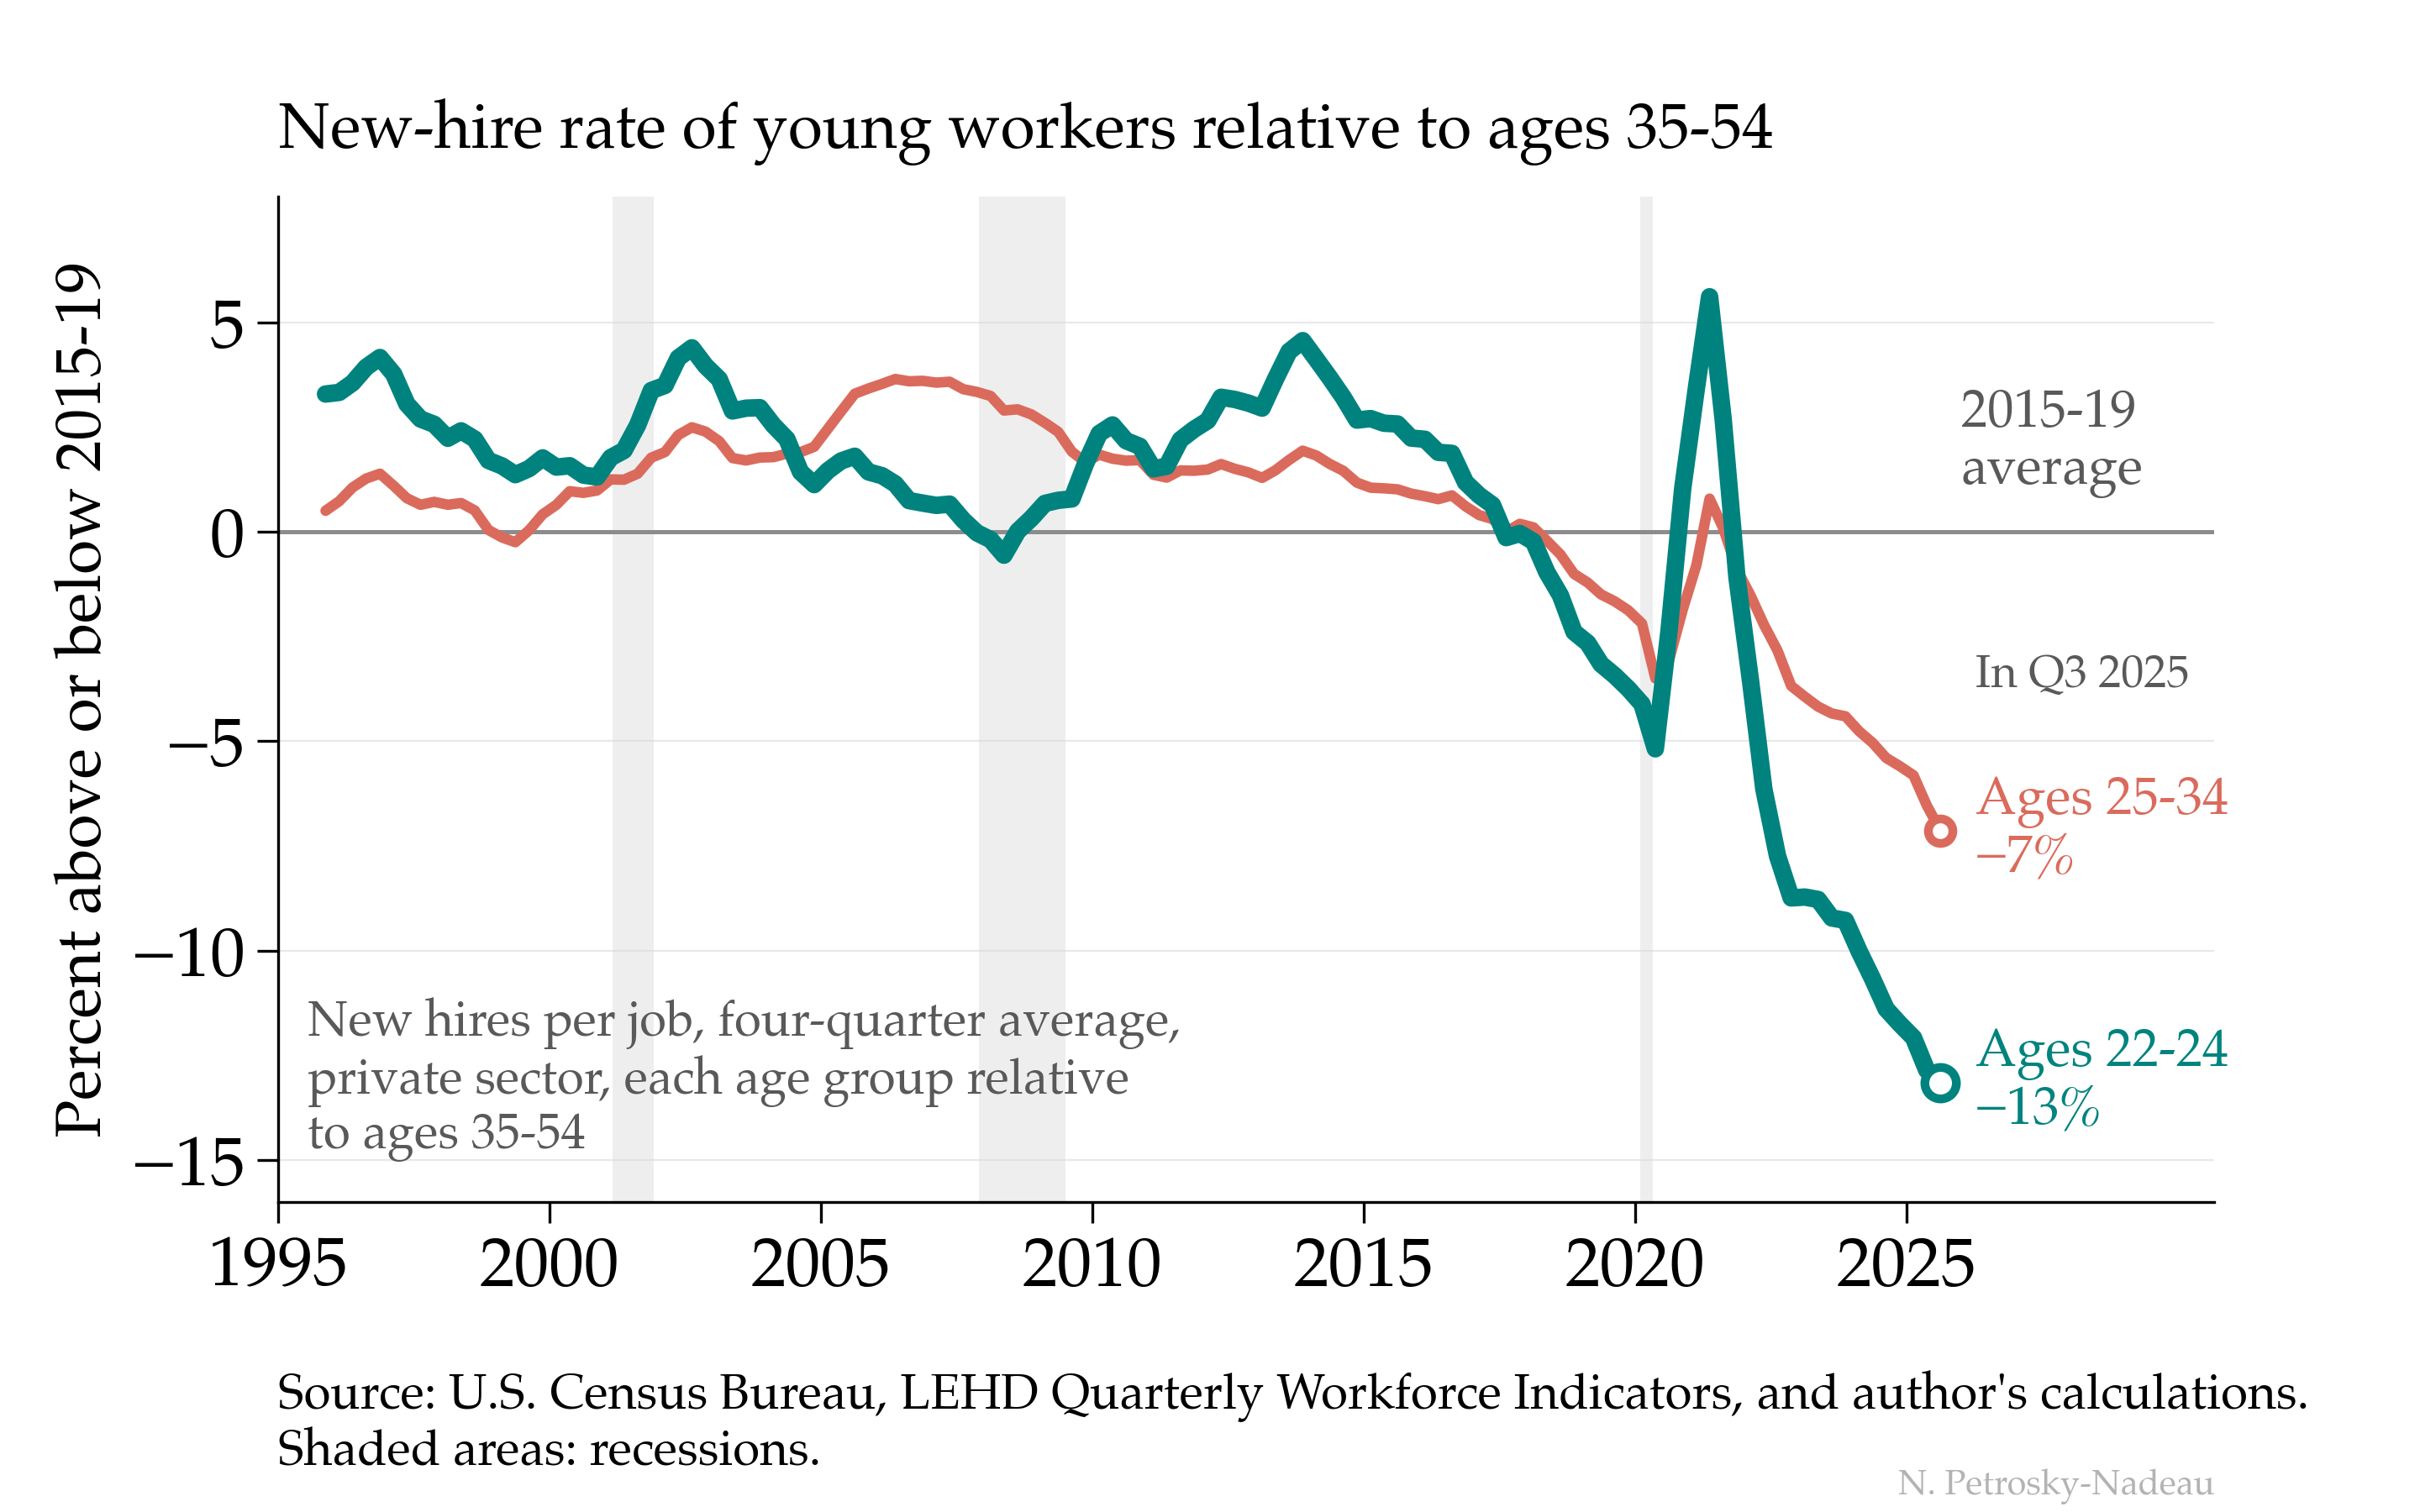
Percent above or below the 2015–2019 average. New hires per job, four-quarter average, private sector, each age group relative to ages 35 to 54. Shaded areas: recessions. Source: U.S. Census Bureau, LEHD Quarterly Workforce Indicators (release R2026Q3), and author’s calculations.
Hover or tap for values; click a legend entry to show or hide a line.
The teal line shows the new-hire rate of 22-to-24-year-olds, counting only hires by an employer they had not worked for in the past year using the wage records employers file every quarter and compiled by the Census Bureau. It is shown against the same rate for ages 35 to 54, whose hiring slowed too but by less. By Q3 2025 the teal line was 13% below its 2015-19 average. For workers aged 25 to 34 (salmon) it was 7% below.